Last edited: August 12, 2024
Published: August 29, 2023

Orbify
Earth Intelligence Specialists
Blog Post
Last edited: August 12, 2024
Published: August 29, 2023
Orbify
Earth Intelligence Specialists
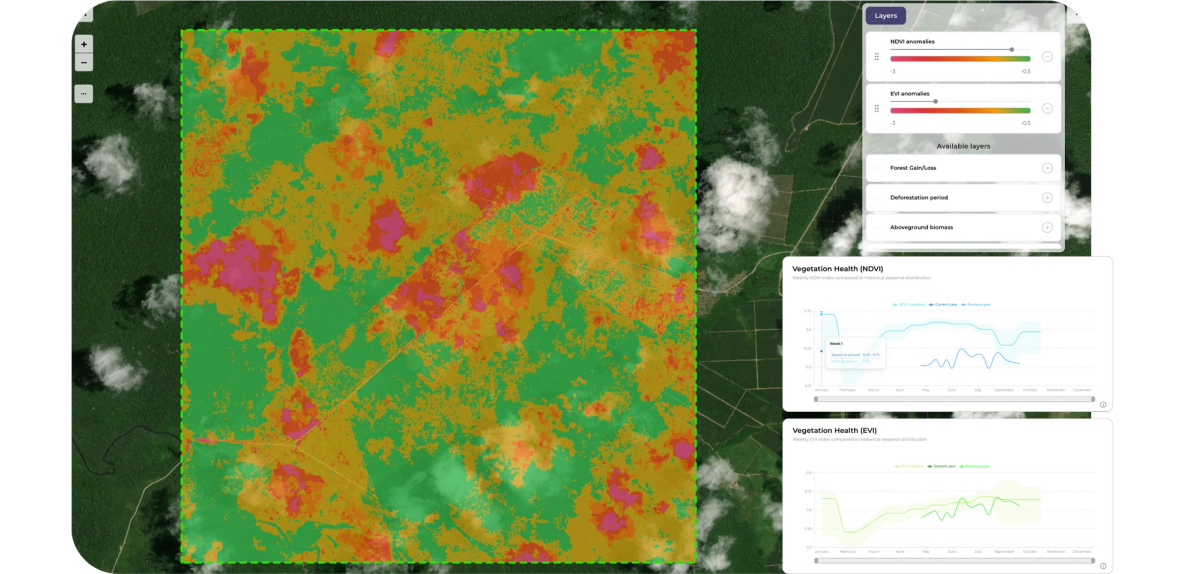
This feature provides you with a comprehensive understanding of vegetation dynamics by utilizing advanced calculations such as NDVI (Normalized Difference Vegetation Index) and EVI (Enhanced Vegetation Index).
The Vegetation Indexes Calculations feature offers an unparalleled depth of insight into vegetation cover and dynamics. Through the calculations, it enables you to harness the power of spectral data for a more comprehensive view of environmental conditions.
Why is this crucial? In an era where environmental changes are occurring at an unprecedented pace, having a feature like Vegetation Indexes Calculations can help professionals make informed decisions that impact both ecosystems and communities.
NDVI and EVI are calculated from satellite images by comparing the reflectance of light in different spectral bands. These indices are crucial for assess vegetation health and monitor environmental changes over time. The NDVI is calculated using the formula:
NDVI = (NIR - RED)/ (NIR + RED)
Where:
NIR is the Near-Infrared reflectance,
Red is the Red reflectance
However, EVI is calculated using the formula:
EVI = 2.5 * (NIR - RED)/ (NIR + 6 x RED - 7.5* BLUE + 1)
Where:
BLUE is the Blue reflectance.
Anomaly detection is a key component of the feature. It involves identifying anomalies in the NDVI and EVI data, which is particularly challenging due to the inherent variations in vegetation growth patterns across different seasons.
To address this challenge, the feature employs a strategy of data segmentation into distinct chunks (weeks or months) followed by the calculation of relevant statistics specific to each chunk. For every month, or week of the year, key statistical metrics such as the median and percentile values are extracted. These metrics capture the sub-seasonal variations present in the time series data.
By deriving these statistics for each chunk, insights into the typical patterns and variability exhibited within that particular time frame are gained. This approach allows for the identification of anomalies within a given time of the year, enabling the prompt detection of forest disturbances as soon as they occur.
Overall, the Vegetation Indexes Calculations feature, with its advanced calculations and anomaly detection capabilities, provides a powerful tool for professionals across various domains to make well-informed choices and undertake proactive actions to safeguard and sustain our natural surroundings.