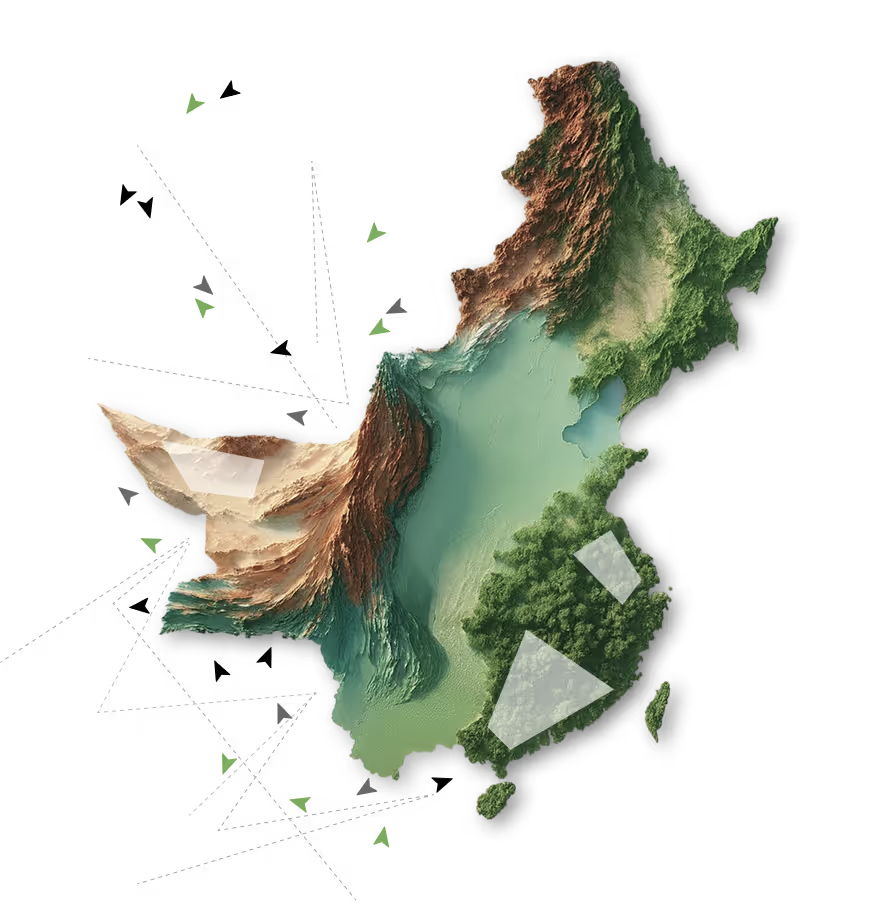

Explore Orbify solutions built for your needs —whether you’re monitoring LNG flows or energy infrastructure. Orbify turns satellite data into actionable intelligence. See how each solution helps you see clearer, act faster, and stay ahead of risk.
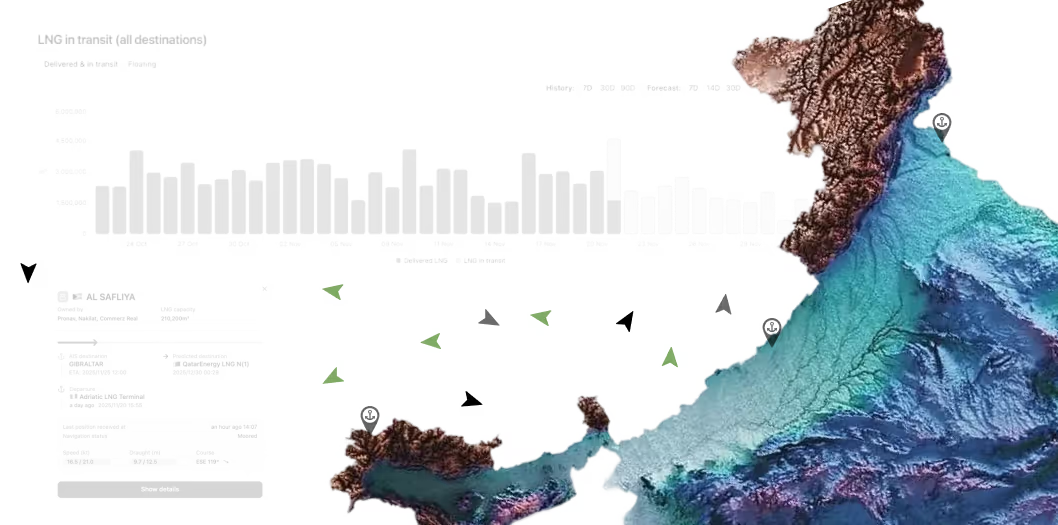
Anticipate market shifts with predictive satellite intelligence. Orbify detects route anomalies, congestion, and arrivals, giving you a head start on global LNG movements.
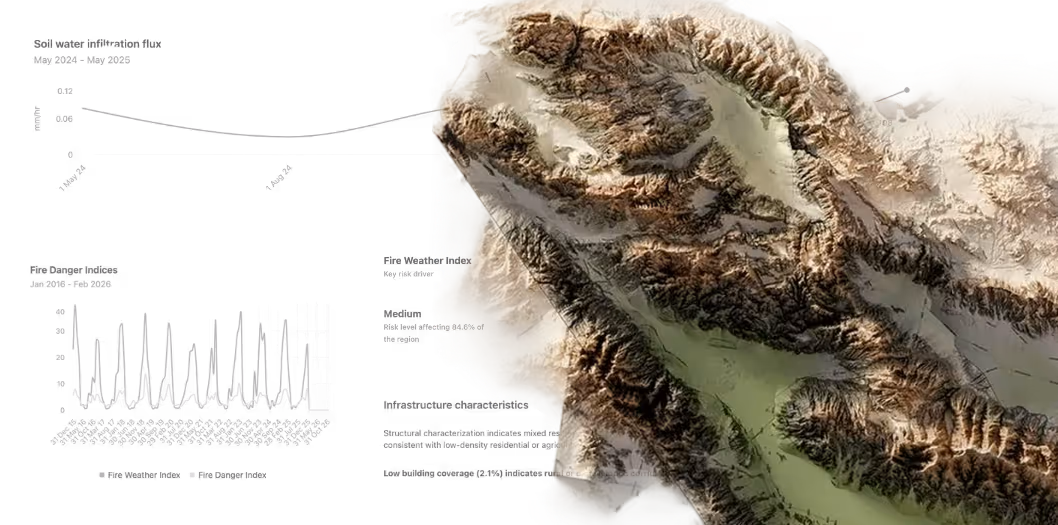
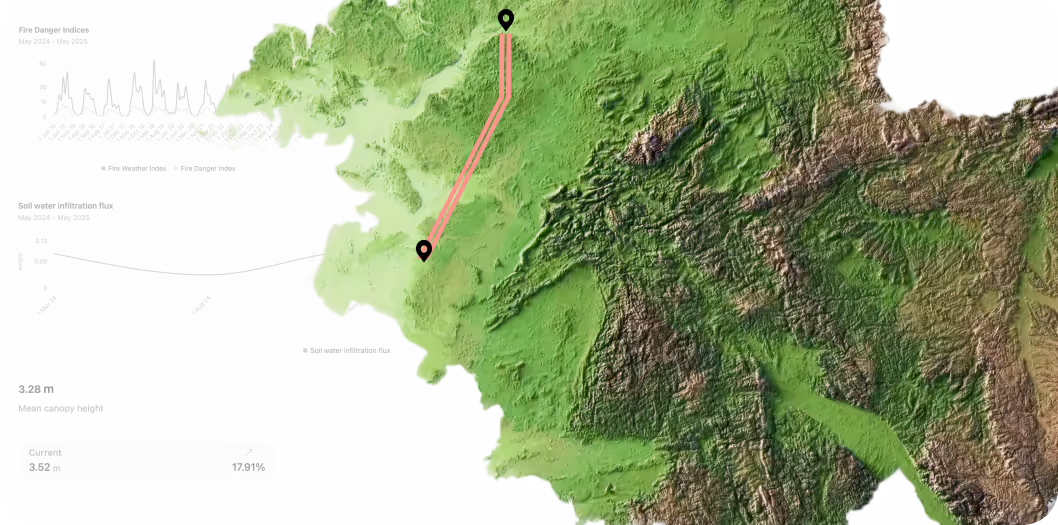
Accelerate energy infrastructure delivery. Orbify helps developers and contractors assess land readiness using satellite and environmental data.
Spot grid risks early with satellite-based AI monitoring.Orbify detects encroachment, assesses risk, and forecasts what’s next.
Vessel Details at Hand Get detailed information about vessel status, history, port calls, ownership, historical route patterns, draught, capacity, speed, average speed and more. Track changes over time with historical graphs.


.png)
.png)
A power trader held a strategic position in North Texas, an area plagued by transmission constraints. While a critical 345-kV line upgrade began in March 2025 with an end-of-year target, the market lacked any public progress updates. Without visibility, the trader had no way of knowing when congestion would ease.
Satellite imagery verified the upgrade was incomplete as of August 2025. Infrastructure showed work preparations and materials on the ground, but critical transmission components were months from operational.
The Outcome: The trader maintained and increased their position based on verified ground truth. They avoided premature exit from assuming completion, keeping their profitable congestion position as constraints persisted.
.avif)

A real estate investor developing datacenter sites requested grid capacity studies. The feasibility study assumed a completed transmission upgrade unlocking 200 MW of available power. No public data confirmed actual project status.
Using high-resolution satellite imagery, Orbify's analysis revealed the upgrade was still under construction. While the study assumed 200 MW of capacity, the actual available capacity was only 60 MW — a 70% discrepancy between projected and physical reality.
The Outcome: By identifying the 140 MW shortfall before capital deployment, the investor avoided a massive over-valuation. They corrected their site selection and financial models based on verified ground truth rather than outdated assumptions.


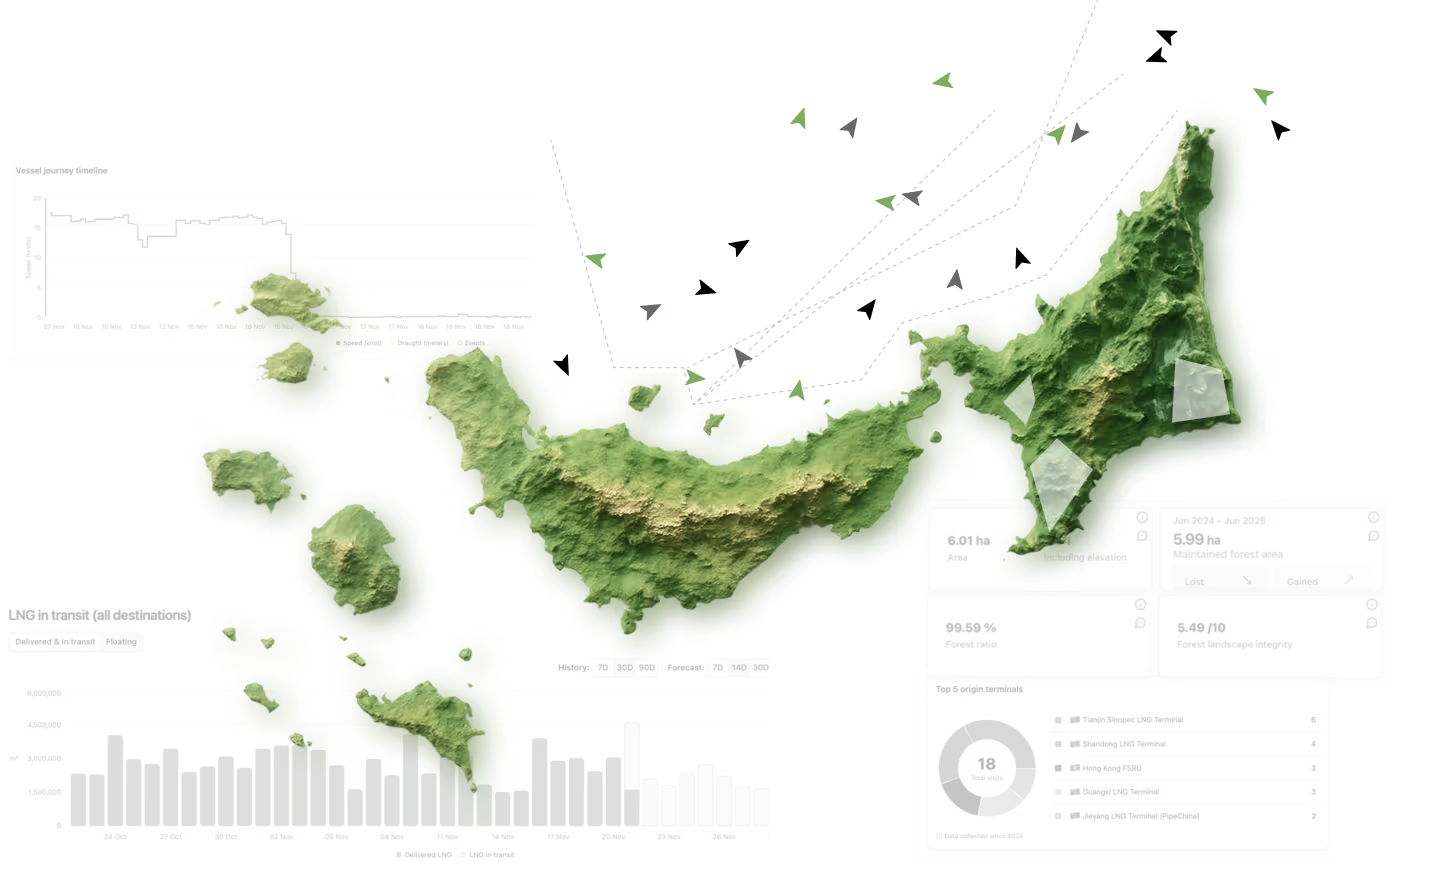
Orbify monitors vegetation threats, climate risks, and infrastructure changes across your entire network — so you can prevent outages, optimize maintenance, and stay compliant.
Start with a 4-week pilot on your priority corridors. No enterprise contracts. No multi-month implementations. Just results you can verify against field data.