Innovative Methodology for Geospatial Insights
Orbify is a SaaS platform that automates the analysis of satellite imagery with help of AI to streamline the measurement of environmental impact as well as planning & monitoring of climate-positive projects.
The methodology is carried out using a geospatial data platform (GDP) developed by Orbify, Inc. (USA). Orbify platform uses three types of satellite imagery to conduct analysis. The data is interpreted by machine learning regression and classification models, employing advanced technology to gather reliable data, using all sensors described below when they are relevant as input signals for calculating respective indicators.
Optical
Optical imagery provided by multiple providers, primarily the Copernicus Sentinel-2 mission, launched by European Space Agency, and the Landsat program operated by NASA. As needed, supplemented with data coming from commercial providers like Axelspace or Planet to ensure high enough revisit time and spatial resolution appropriate for the specific project. All satellites provide imagery in, at least, four basic bands (visible red, green, and blue, and near- infrared(NIR)), while the Sentinel-2 mission goes up to 10m spatial resolution and 13 bands of spectral resolution (besides visible and near-infrared, e.g., vegetation red edge and short-wave infrared).
Lidar
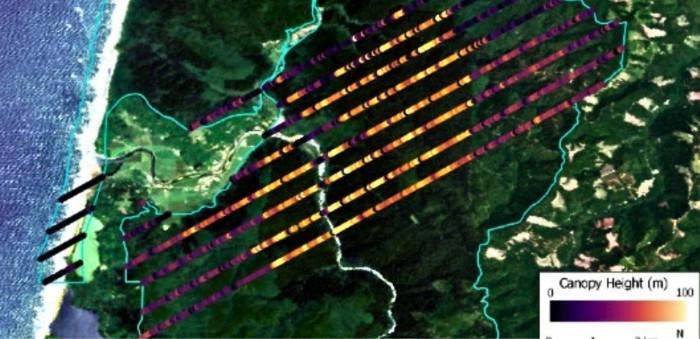
LiDAR (Light Detection and Ranging) is used for measuring forest canopy height, canopy vertical structure, and surface elevation, obtained from NASA’s GEDI (Global Ecosystem Dynamics Investigation) mission that uses an instrument attached to the International Space Station
SAR
SAR (Synthetic Aperture Radar) – from multiple providers primarily the European Space Agency’s Sentinel-1 SAR satellite operating in the C-band spectrum providing a 10m spatial resolution and 12-day temporal resolution, supplemented by commercial imagery as needed.
Biomass
Orbify is developing a proprietary algorithm for more accurate Above Ground Biomass (AGB) estimation. It utilizes data from the GEDI mission and Sentinel imagery to create a predictive model for forest monitoring.

Forest/Non Forest
The Forest/Non-Forest model is an advanced tool for land cover classification and forest monitoring, combining data from Sentinel-1, Sentinel-2, and GEDI LiDAR for accurate change detection.

Feature Space Creation and Labelling
Satellite and GEDI data are temporally aligned to create a rich feature space, and labelling uses predefined categories like tree, urban, and water for accurate training data.
The feature space is created by carefully aligning the satellite and GEDI data temporally. This process ensures that the satellite features correspond to the same time periods as the GEDI measurements, resulting in a rich feature space that combines spectral and textural information from satellite imagery with structural information from GEDI data.
The labelling process utilises a predefined set of categories: tree, urban, water, fieldland, and baresoil. These categories are defined using a combination of GEDI metrics and ancillary data, employing a multi-criteria approach for robust and accurate labelling. For example, the "tree" class is identified using both height information (rh98 ≥ 7m) and tree cover percentage (≥ 40%). This multi-faceted approach to labelling helps create more reliable and accurate training data for the model.
Model Training and Evaluation
The model is built using a Random Forest classifier, with oversampling for class balance and dimensionality reduction techniques for performance validation.
The heart of this approach is a Random Forest classifier, implemented through Google Earth Engine's smileRandomForest algorithm. To address potential class imbalance issues, particularly the likely underrepresentation of forested areas, the approach applies an oversampling technique to the tree class. This ensures that the model is equally sensitive to all classes, despite potential imbalances in their natural occurrence.
The model is trained on a carefully selected set of input properties, including spectral bands, derived indices, and texture features. This comprehensive feature set allows the model to capture various aspects of land cover characteristics.
Evaluation of the model involves generating various metrics to assess its performance. Additionally, dimensionality reduction techniques such as Principal Component Analysis (PCA) and t-distributed Stochastic Neighbour Embedding (t-SNE) are implemented to validate the distinction between classes and understand how the feature space behaves. Feature importance is calculated from the trained Random Forest, providing insights into which features contribute most significantly to the classification process.
Prediction and Change Detection
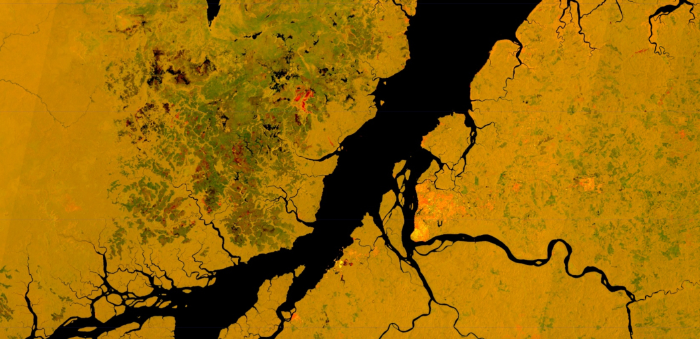
For generating predictions, the trained classifier is applied to new satellite imagery. This process produces binary forest cover maps, effectively distinguishing forested areas from non-forested areas based on the learned patterns from the training data.
Visualisation
To communicate results effectively, the approach includes a sophisticated visualization step. It creates color-coded maps showing areas of maintained forest, forest loss, and forest gain. These visualizations are prepared as named layers with associated legends, making them readily interpretable for end-users.
Indicators
Land Use Analysis
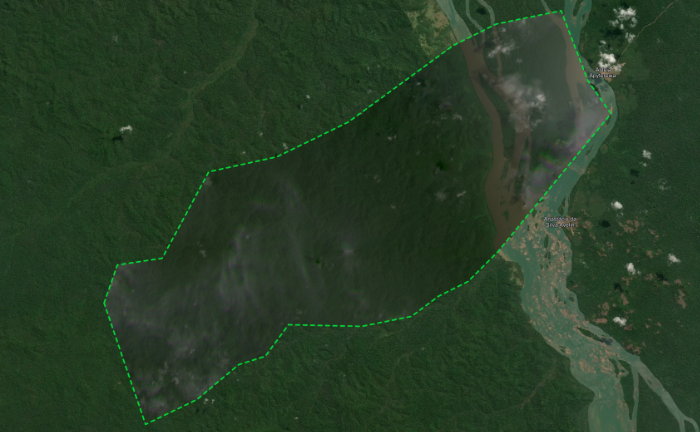
Project & jurisdictional area mapping
Change analysis
Change patterns
Vegetation Condition
AGB for carbon stock assessment
Canopy Height
Forest Canopy Cover
Vegetation Health
Vegetation Stress index
Environmental Conditions
Air quality
Water quality
Freshwater resources mapping
Humidity
Temperature
Wind
Natural & Anthropogenic Hazards
Drought analysis
Air pollution analysis
Flood analysis
Landslide analysis
Thermal extremes
Wildfire analysis
Soil erosion
Biodiversity Classification
Distribution of biodiversity