Last edited: September 24, 2024
Published: June 14, 2023

Orbify
Earth Intelligence Specialists
Blog Post
Last edited: September 24, 2024
Published: June 14, 2023
Orbify
Earth Intelligence Specialists
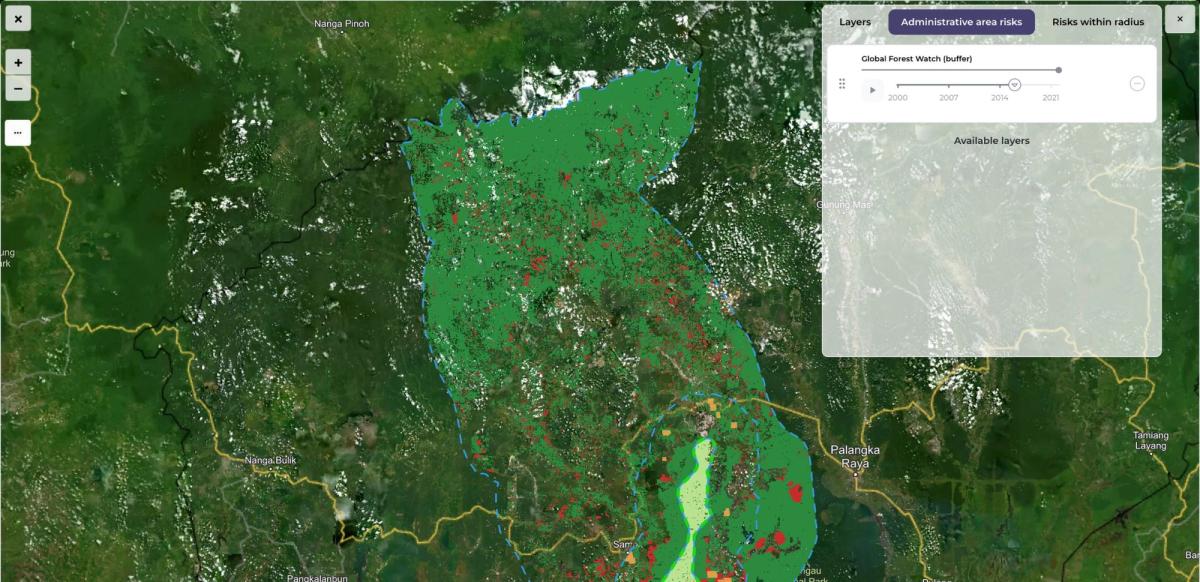
While monitoring and gathering data for the project area is one of our top goals, we’re aware that there are several surrounding factors that may impact the project area itself.
That’s why we’re rolling out additional insights, calculated for automatically adjusted buffer area, surrounding the project, as well as for detected administrative boundary.
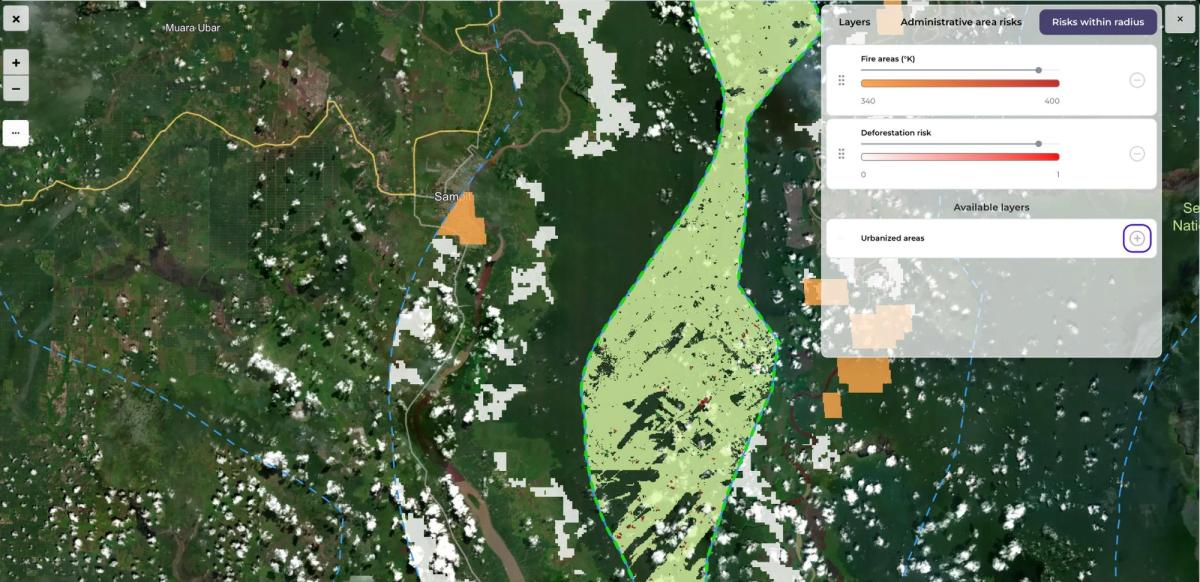
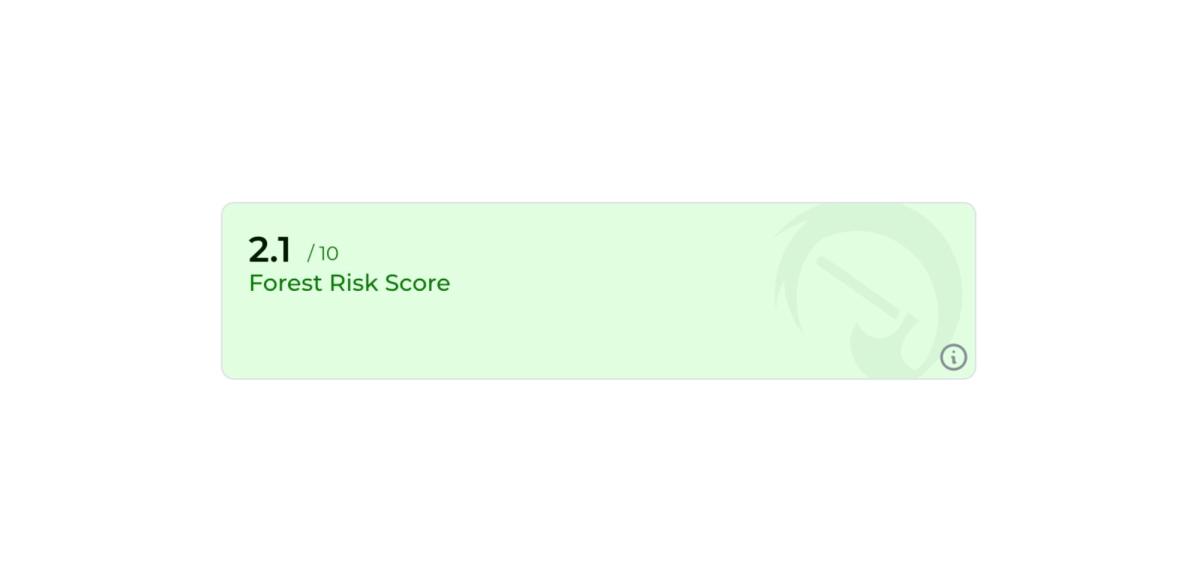
Based on the project and project’s surroundings analysis we’ve built our own forest risk index - an AI based approach to computing deforestation risk based on several factors, like fire risk, development of urban areas, population changes, previously observed forest state, etc.
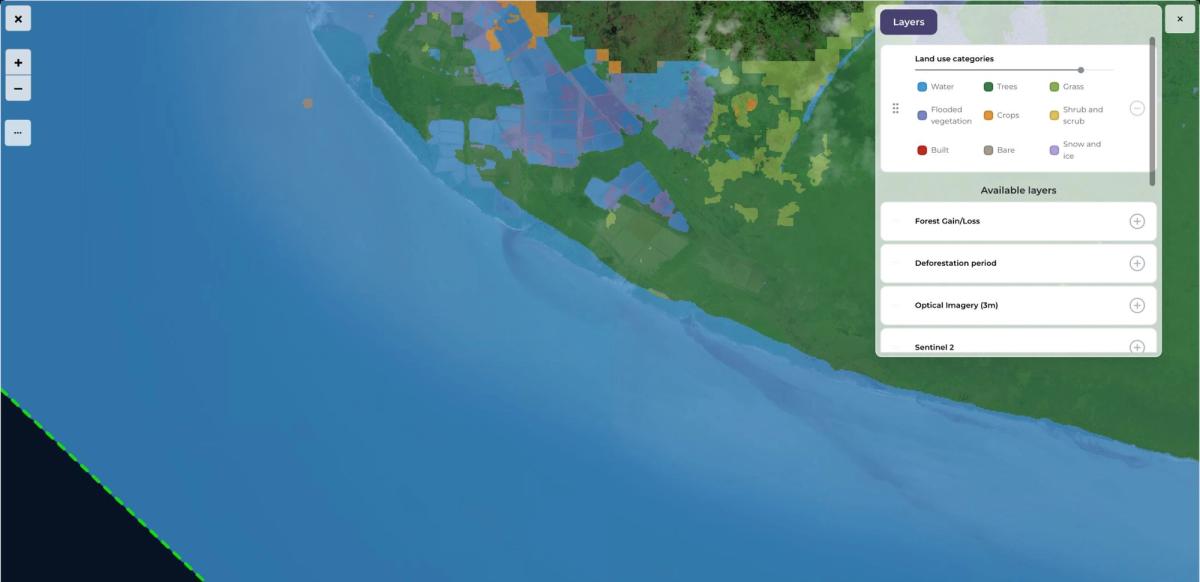
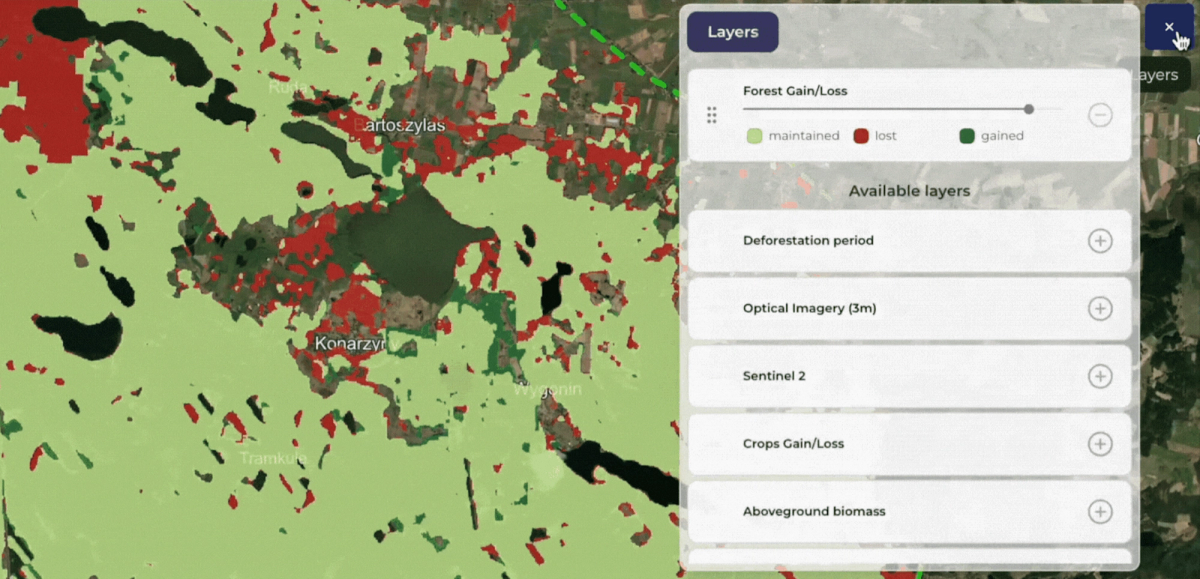
To make viewing map layers easier and less cluttered, we’ve introduced the possibility to filter displayed layer values based on detected legend entries.
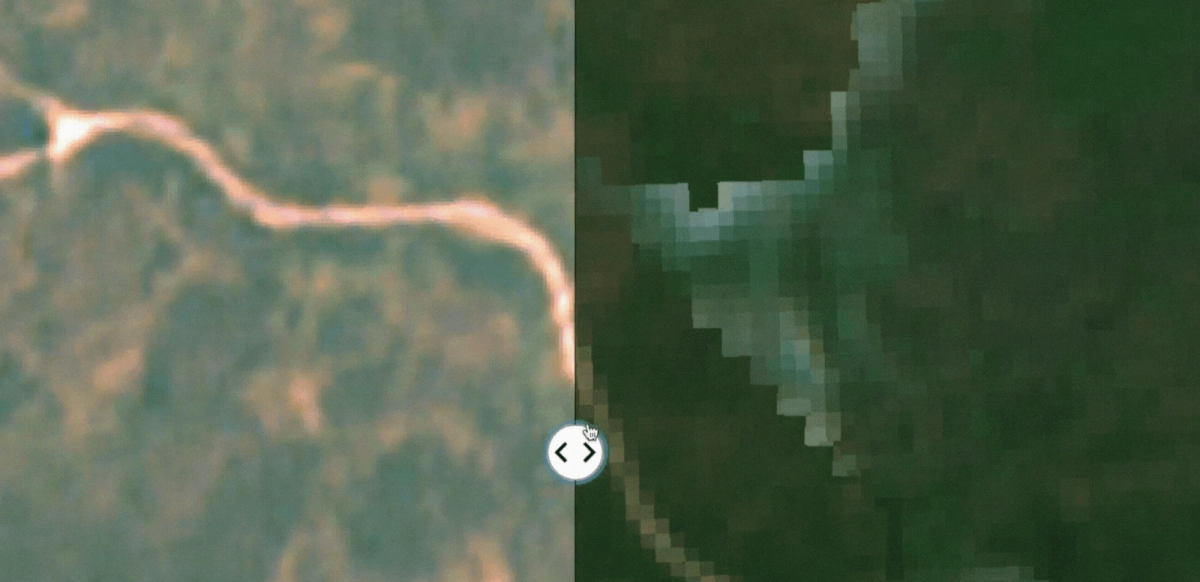
Sentinel-2’s 10m resolution is good enough for most cases, but higher resolutions always improve the quality of data. High resolution images are also really useful for visual inspection.
Using AI-based image enhancer for processing, we’re now making 2.5m super resolution Sentinel-2 images available on the Geospatial Data Platform.
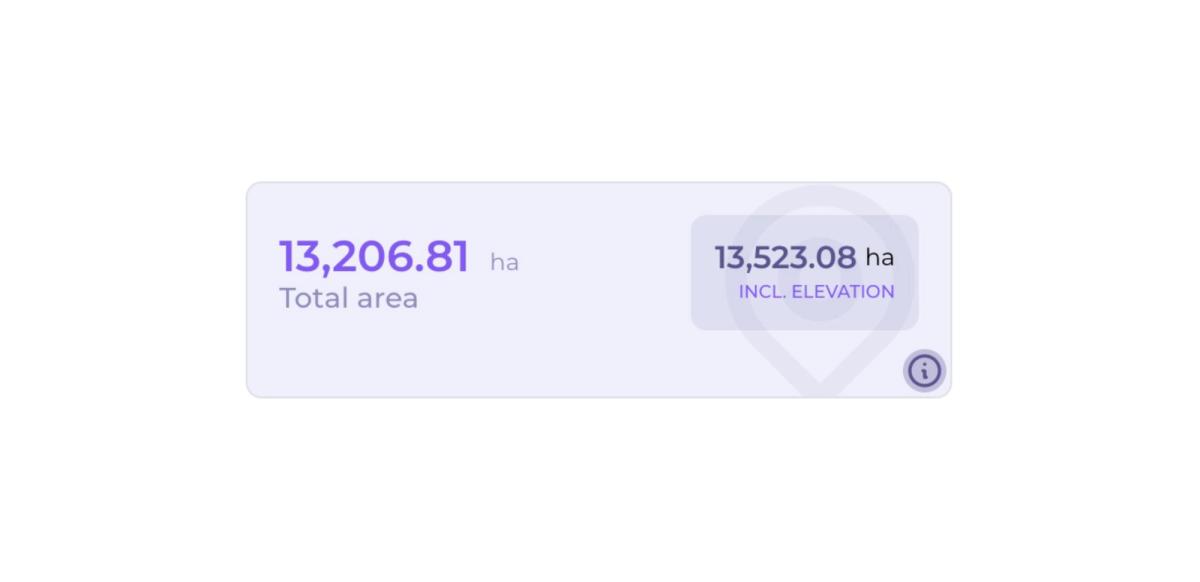
In most cases, the geodesic calculation of project’s total area is good enough to provide a reasonable estimate.
We’ve decided to improve the calculation by adding additionally calculating the project’s area with terrain elevation included in the calculations.
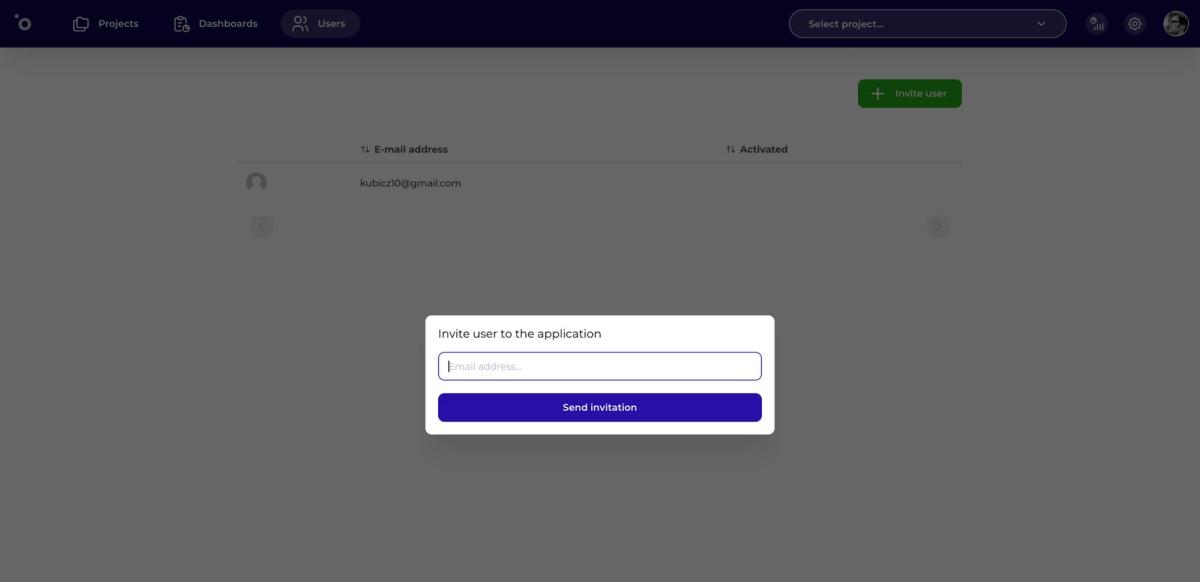
We’ve rolled out an intuitive and easy to use user management screen for your GDP application, allowing invite users to the application’s dashboard view.
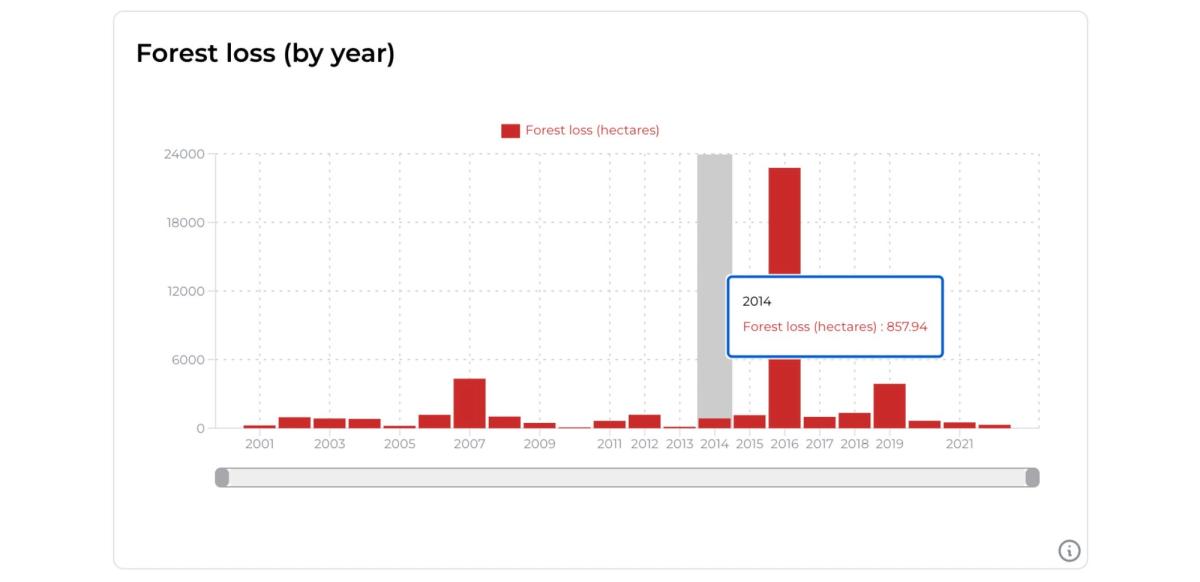
Besides the regular detection of gained, lost and maintained forest areas, we’ve added more detailed visualisation of when the actual forest loss occured.
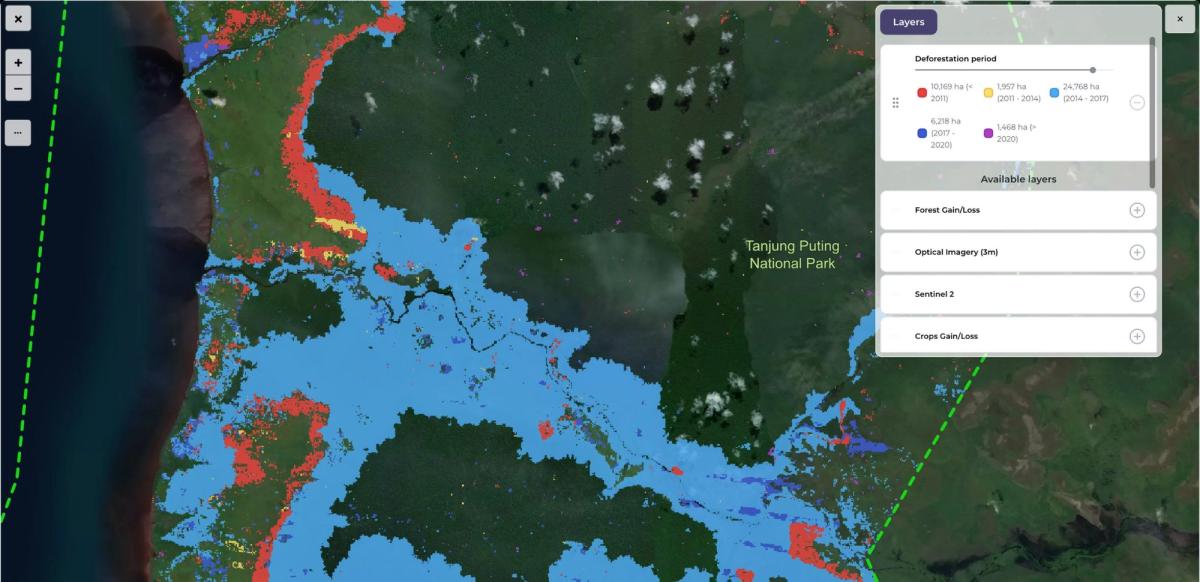
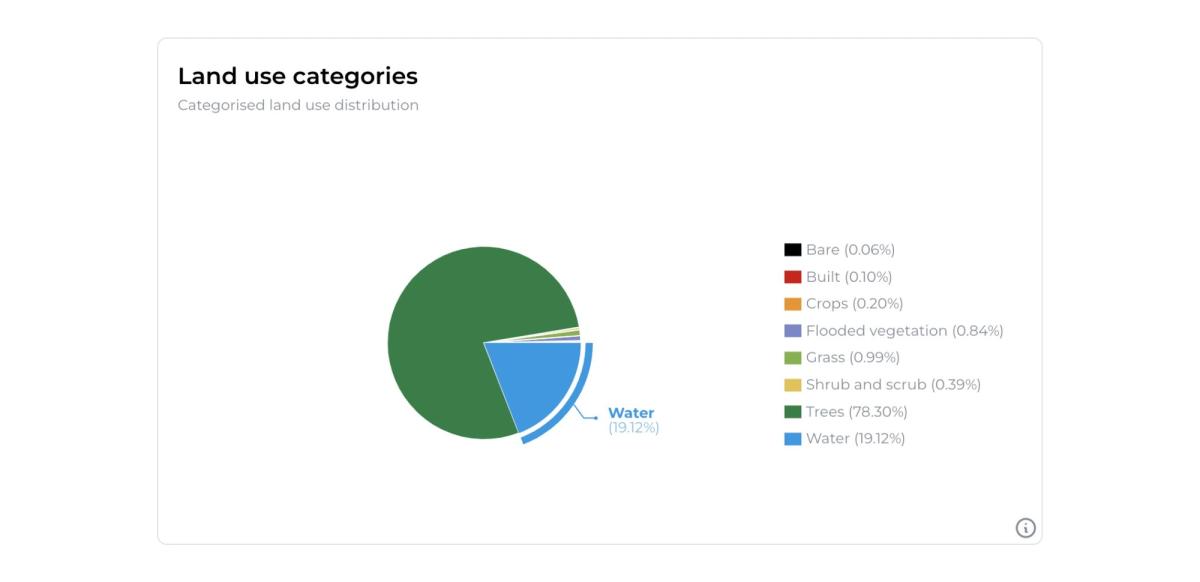
In order to improve project monitoring, we’ve introduced land use categorisation related features, to allow quick visualisation of specific land cover type, as well as to calculate land cover related statistics.