Last edited: August 12, 2024
Published: October 16, 2023

Orbify
Earth Intelligence Specialists
Blog Post
Last edited: August 12, 2024
Published: October 16, 2023
Orbify
Earth Intelligence Specialists
At Orbify, we’re rolling out a completely redesigned approach to building reports and analyses for your projects monitored with Orbify Platform.
Until now, you had the ability to select indicators for project analysis, but we've taken it up a notch. We're introducing a brand-new catalog of ready-to-use analysis data, including map layers, charts, data tables, and indicators, all conveniently categorized for common use cases like deforestation, NbS projects, and sustainability analysis.
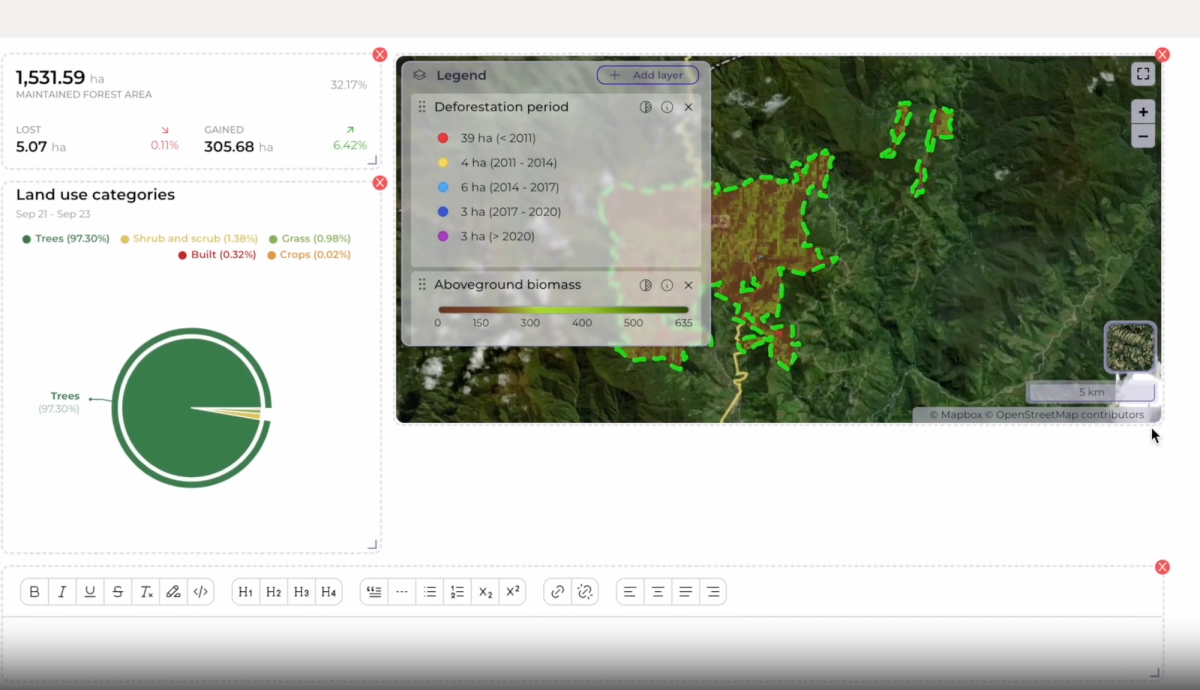
But that's not all – we've also added pre-built report templates to jumpstart your tasks. These templates are fully customizable, so you can tailor them to your exact requirements. And, of course, you still have the option to create reports from scratch on a blank canvas.
Additionally, we're continually expanding the catalog of data and report templates with quality-checked information. Stay tuned for more updates as we strive to improve your reporting experience. Take a sneak peek in the demo video below.

Want to get a custom demo for you? Schedule a personalized call with us.