Last edited: August 12, 2024
Published: September 18, 2023

Orbify
Earth Intelligence Specialists
Blog Post
Last edited: August 12, 2024
Published: September 18, 2023
Orbify
Earth Intelligence Specialists
Useful for indicating different habitat types within a region or area of interest. It is widely used in ecological analyses, often used to quantify potential habitat for a species within an area. Habitat change between 2015 and 2019 is also supported.
Date range: 2015-2019
Reference: Jung, M., Dahal, P.R., Butchart, S.H.M. et al. A global map of terrestrial habitat types. Sci Data 7, 256 (2020).
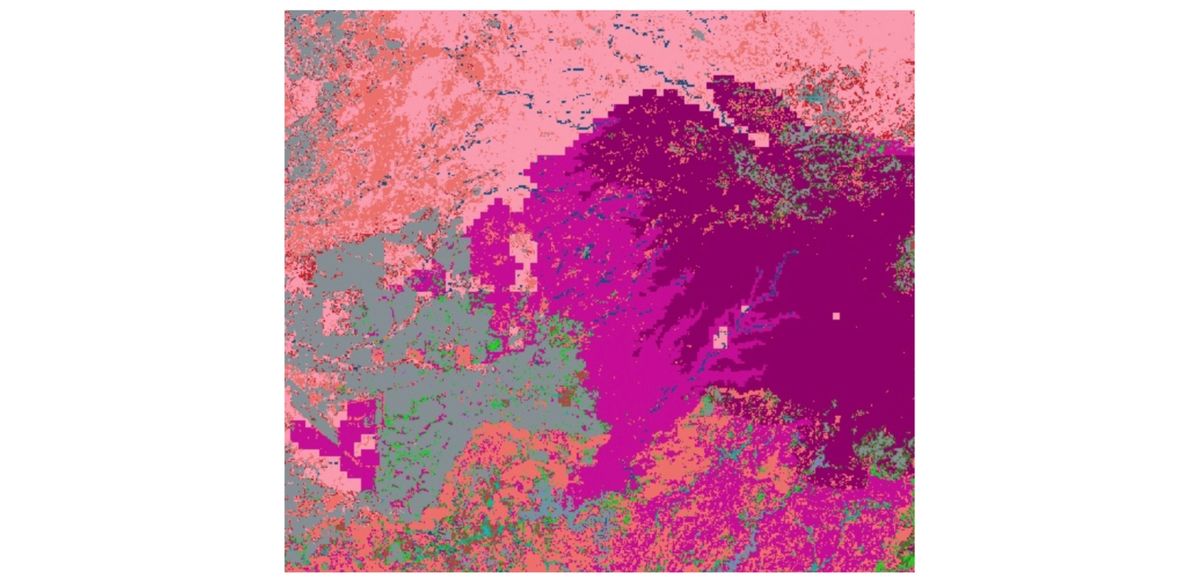
Mosaic of habitat types in Cambodia in 2019
Use Cases:
Ecological Research: Understand the distribution of different habitats and study their dynamics over time.
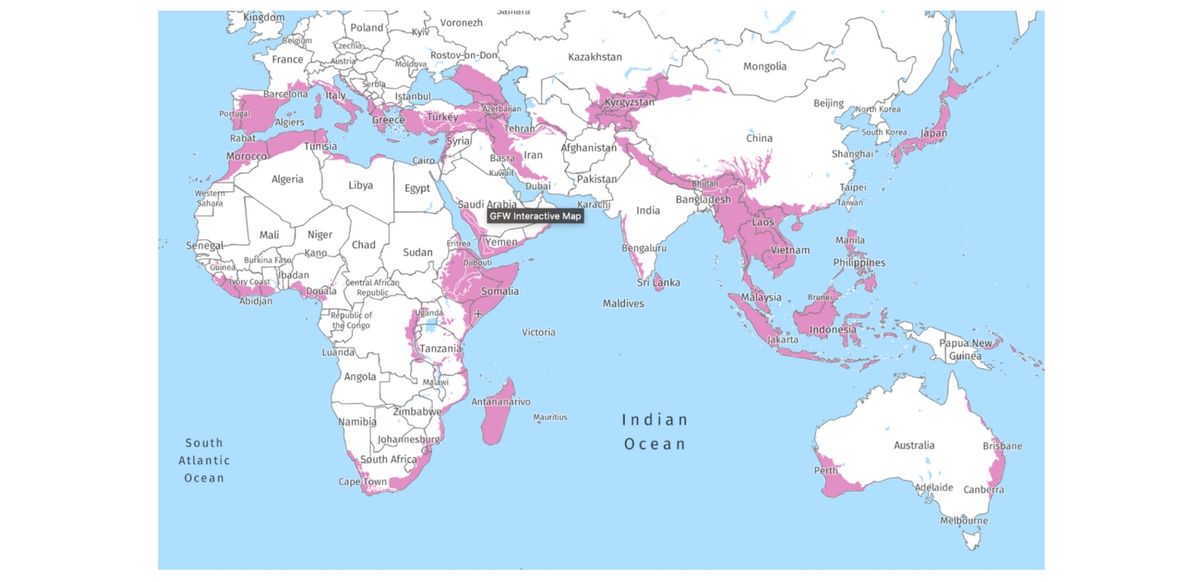
Displays Conservation International’s biodiversity hotspots—defined regions around the world where biodiversity conservation is most urgent because of high levels of endemism and human threat. This dataset identifies areas where there are at least 1,500 species of endemic vascular plant species and the area has lost 70% of its primary native vegetation. This allows the user to identify if the forest contains important and threatened habitat.
Temporal resolution: 2011
Reference/link: https://www.conservation.org/priorities/biodiversity-hotspots
https://data.globalforestwatch.org/documents/4f661b45cc8249afa2d25ed624bc74f2
Use Cases:
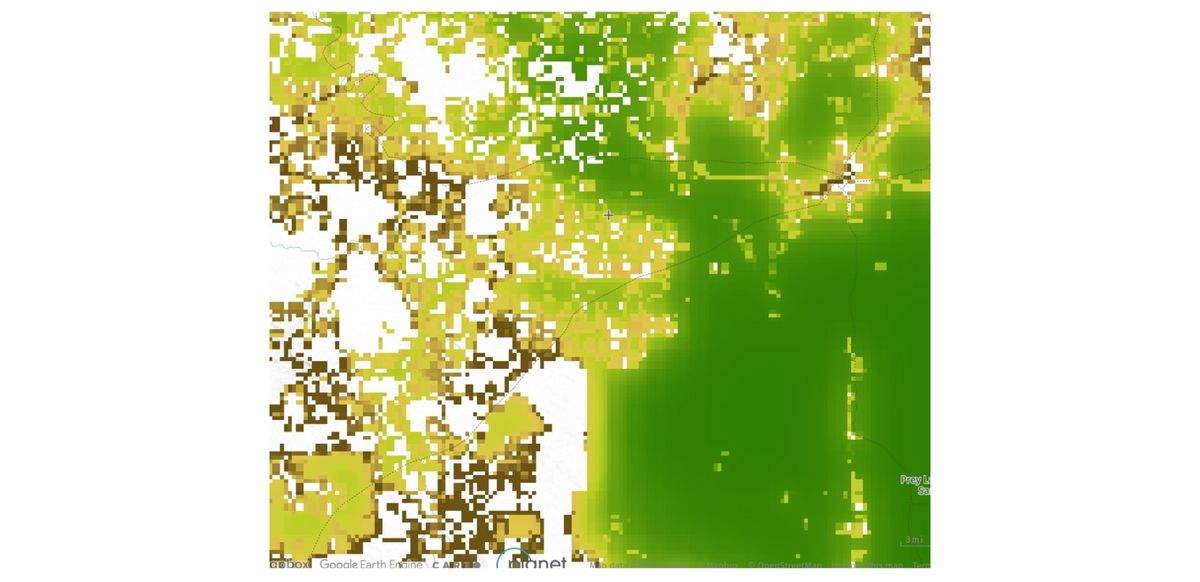
Combining indicators representing the forest extent, observed pressure from infrastructure, agriculture and recent deforestation, inferred pressure associated with edge effects and activities such as hunting and selective logging, and changes due to forest connectivity. High scores reflect high integrity, and low scores represent areas with high pressure or disturbance.
Resolution: 300 x 300mDate: 2019Reference: Grantham, H. S. et al. (2020). Anthropogenic modification of forests means only 40% of remaining forests have high ecosystem integrity. Nature communications, 11(1), 1-10. Forest Landscape Integrity Index
Use Cases:
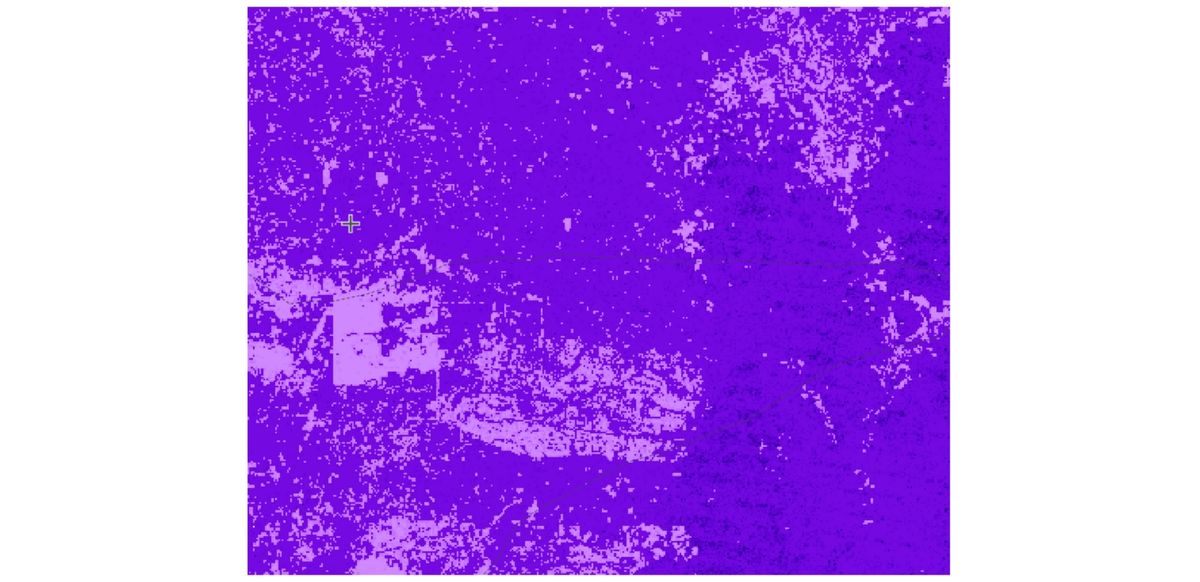
This layer measures human impact on species community intactness, especially within forested areas. It highlights changes caused by factors like land use conversion. The intactness is graded, with the highest value indicating no human impact and lower values showing reduced intactness. Drawing from the PREDICTS database, which has over 3 million records, the tool specifically models the effects of land use changes and population density on species communities in forested biomes. The final model integrates data from the GFW forest change database and a refined land use map, offering a detailed view of how forest changes affect biodiversity within these biomes.
Date range: 2018
Spatial resolution: 1 x 1 km
Reference: Hill, S. L., Arnell, A., Maney, C., Butchart, S. H., Hilton-Taylor, C., Ciciarelli, C., ... & Burgess, N. D. (2019). Measuring forest biodiversity status and changes globally. Frontiers in Forests and Global Change, 2, 70. https://doi.org/10.3389/ffgc.2019.00070
Use Cases:
This indicator describes changes in both species diversity and population size over time for many classes of the vertebrate animals: (grouped by mammals, birds, reptiles, amphibians, fish). This indicator has been developed by the Orbify team, based on the GBIF database. The data will have a 1 km spatial resolution, with the date range 2018-2023.
Use Cases: