Reduced Emissions from Deforestation and Degradation in Keo Seima Wildlife Sanctuary
Last edited: September 20, 2023
Published: September 13, 2023

Orbify
Earth Intelligence Specialists
Blog Post
Last edited: September 20, 2023
Published: September 13, 2023
Orbify
Earth Intelligence Specialists
In the Orbify Review, we pick an NbS project related to the Voluntary Carbon Market from one of the credible registries and review it using our Geospatial Data Platform (GDP) to show how can you use and take advantage of our platform to analyse a VCM project or even to monitor and use the data to include in your PDD on the project development. Here we review a project based on the project description provided in the Verra registry.
For this Review, we've selected the, located in Cambodia. The project is registered on Verra Registry.
VCS Project Type: Agriculture Forestry and Other Land Use
The project area is located in the Northwestern, Oddar Meanchey province of Cambodia. Its primary purpose is the implementation of a REDD (Reduced Emissions from Deforestation and Degradation) project. In the 1970s, this region was densely forested; however, it has since faced significant deforestation challenges. Various factors have contributed to deforestation, including legal and illegal logging, forest fires, economic land concessions, and encroachment. Furthermore, rapid economic growth, population expansion, migration, and speculative land activities have placed extra pressure on the area.
The project reports a 2% annual deforestation rate between 2002 and 2006 attributed to tree felling and burning by migrant farmers and land concession holders. In response to these threats, local communities have taken action by establishing forest protection groups and large Community Forestry (CF) areas.
The mission of this project is to safeguard the remaining forests, which are essential for water resources and marketable products. Collaborators involved in this initiative include local communities, the national Forestry Administration (FA), Pact, Terra Global Capital (TGC), and Community Forestry International (CFI). This project falls under the category of Agriculture, Forestry, and Other Land Use (AFOLU) within the REDD framework, with a specific classification as "Preventing Unplanned Mosaic Deforestation and Degradation" (PUMDD).
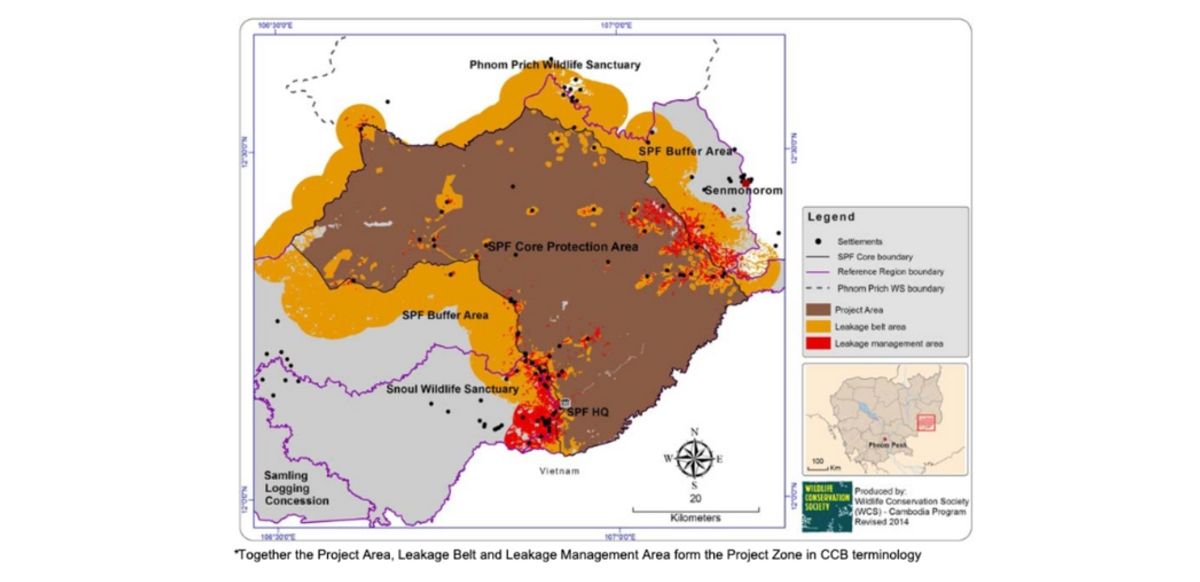
Figure 1: The Project Zone as provided by the project description. The crediting area for this project are the forested areas within the SPF Core Projection Area. Areas around settlements and roads are excluded from the Project Area and form part of the leakage area.
The Project Zone includes the following areas:
Additionally, the document provides maps and descriptions of the Reference Regions used to generate deforestation projections inside the project area.
In our review, we will assess the project and how close the ex-ante deforestation projections are to the observed changes. Unfortunately, the only digital file provided by the project is the area designated as the SPF Core Projection Area. This area contains both the crediting area and some non-forested land, as well as some leakage areas. Additionally, the Leakage Area and Reference Regions were not provided by the Verra registry; instead, proxies were generated using the maps and descriptions in the PDD. For this reason, the Reference and Leakage areas may not perfectly align with those outlined in the project PDD.
We are not considering any potential changes in the area since the first PDD submission or the second baseline assessment. Our objective is not to provide ratings or guide potential investors on whether they should invest in this project. Instead, we will demonstrate how our platform can be used to analyze the project of interest. If you are seeking project investment consultancy services, please feel free to contact us.
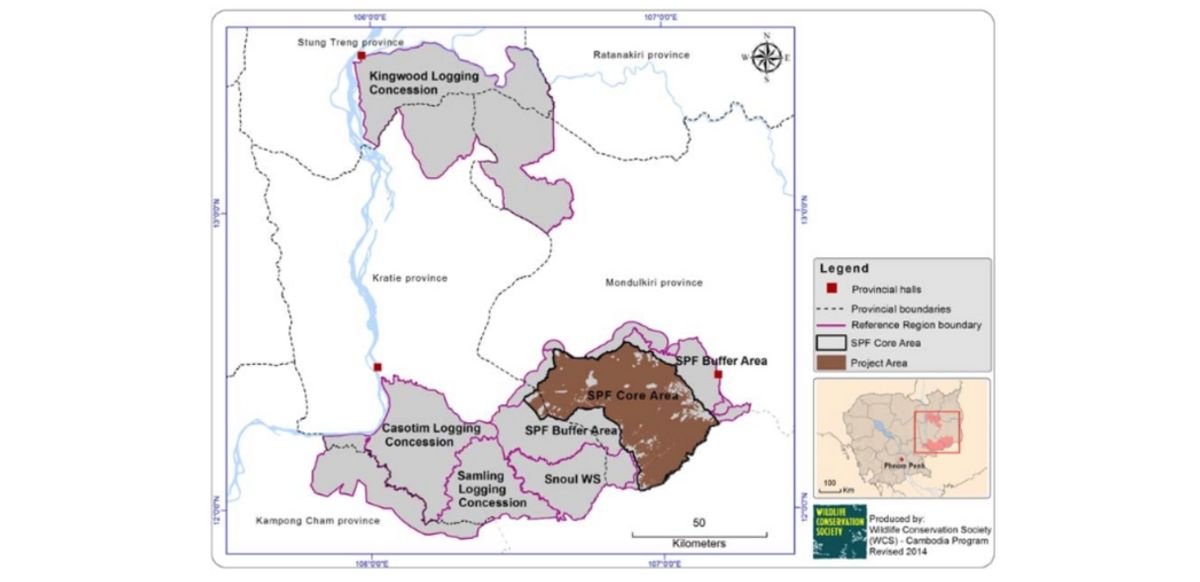
Figure 2: The project area and reference areas as described by the project description.
The reference regions include the project area, the neighbouring areas and an area in the north east of Cambodia. According to the description, the inclusion of an additional neighbouring block was deemed necessary as the southern block alone failed to meet the minimum area requirement. These two blocks share notable similarities in terms of legal protection levels, vegetation types, and geographical features. Moreover, they face similar challenges in terms of deforestation threats. Other areas adjacent to the project area, considered for a reference area, do not closely align with the criteria for similarity, primarily due to differences in legal status and a significantly lower presence of dense evergreen forest or hilly terrain. It's worth noting that the northern section of the reference region shares certain commonalities with the main southern portion, including the fact that both are intersected by a major trunk road that has undergone upgrades over time. Additionally, both regions are associated with an active deforestation front moving from west to east.
The reference region covers 996,951 ha of forest and non-forest land including the project area. Our approximation of the reference area covers 951,830 ha.
The project has defined the leakage belt through a mobility analysis by developing buffers around local community areas that are located within or adjacent to the park and around access routes near the boundaries along which new farming areas and settlements might develop.
In our analysis we generated a leakage belt using a buffer of 4200 km from the project boundaries, removing areas which extended into Vietnam. We use this area for qualitative comparisons only.
Project Area
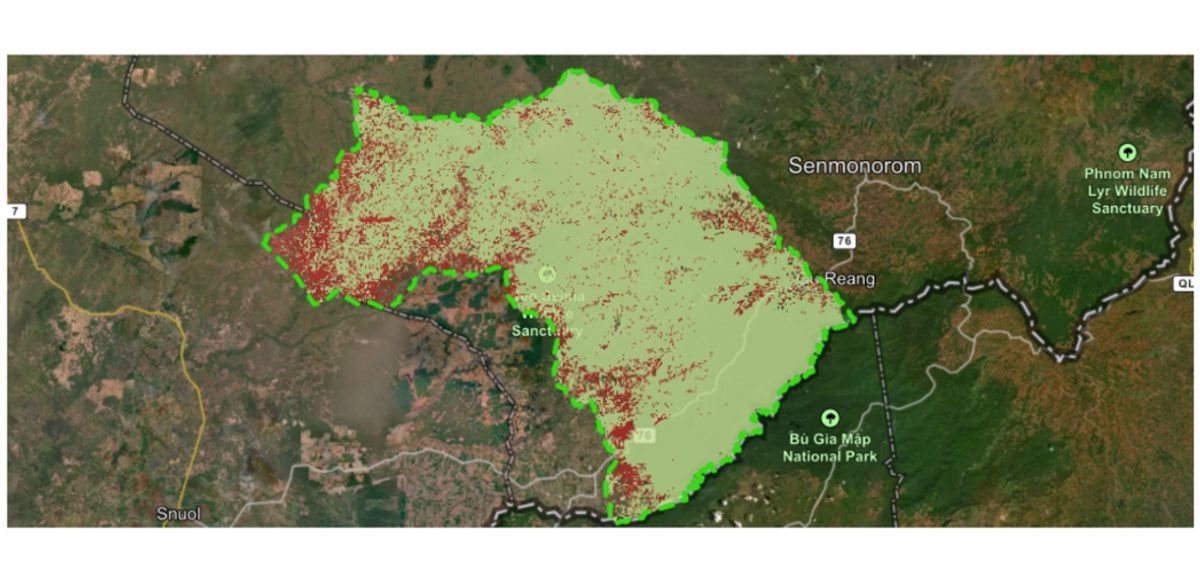
Figure 3: Forest loss since 2017: Deforestation is localised to the west side of the project and is also present around the settlements identified in the project description.
The area we analyse (SPF Core Area) using our platform is smaller than the total Seima Protection Forest area (SPF = 292,690 ha) and greater than the reported forested project area (166,983 ha) which is the area used to generate credits. As previously mentioned, this is because the provided geospatial data file (.kml file) excludes some of the management areas and leakage areas present in the SPF, and our area includes non-forested areas and areas excluded from the project area which are considered ‘leakage zones’. The Orbify platform gives the current forested area, which is less than the project area, likely due to ongoing deforestation since the project start. The Global Forest Loss dataset (Hansen et. al.) can be used to calculate the forested area in 2010, which was 161,977 ha. This suggests less than 10 ha of forest cover is included in the project area we are assessing compared to the crediting area in the report.
Our analysis which uses the Global Forest Change* dataset to determine forest loss since 2001 suggests that deforestation has increased since the project start date (2010)
*Hansen, M. C., P. V. Potapov, R. Moore, M. Hancher, S. A. Turubanova, A. Tyukavina, D. Thau, S. V. Stehman, S. J. Goetz, T. R. Loveland, A. Kommareddy, A. Egorov, L. Chini, C. O. Justice, and J. R. G. Townshend. 2013. “High-Resolution Global Maps of 21st-Century Forest Cover Change.” Science 342 (15 November): 850–53. Data available from: earthenginepartners.appspot.com/science-2013-global-forest.
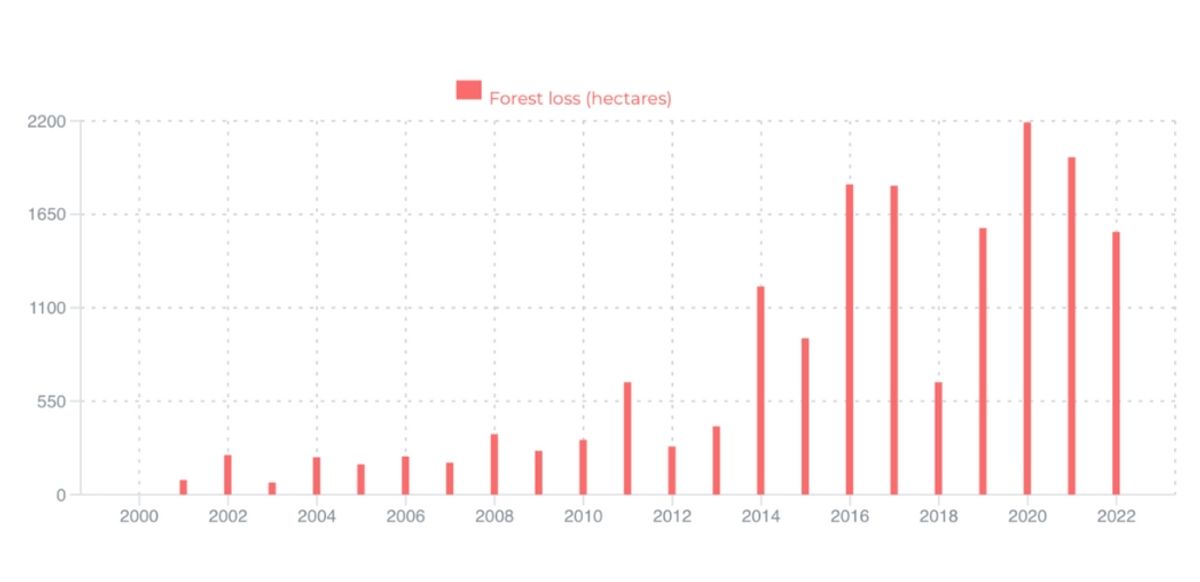
Figure 4: Forest loss within the project area seems to have increased since the start of the project crediting period (2010) this may reflect changes in the methodology used to detect forest losses. Note: The methods behind this data have changed over time, and an increase in deforestation after 2015 may be due to an increase in the sensitivity of the methods used to generate this data.
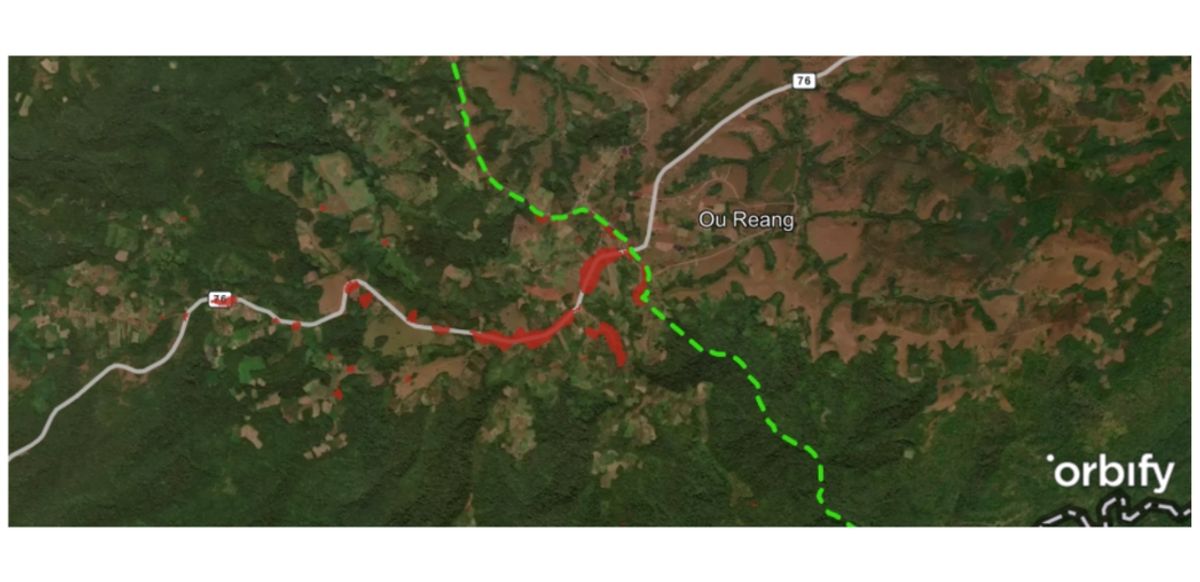
Figure 5: The Orbify platform can be used to detect built areas and settlements within the project area.
Leakage Area
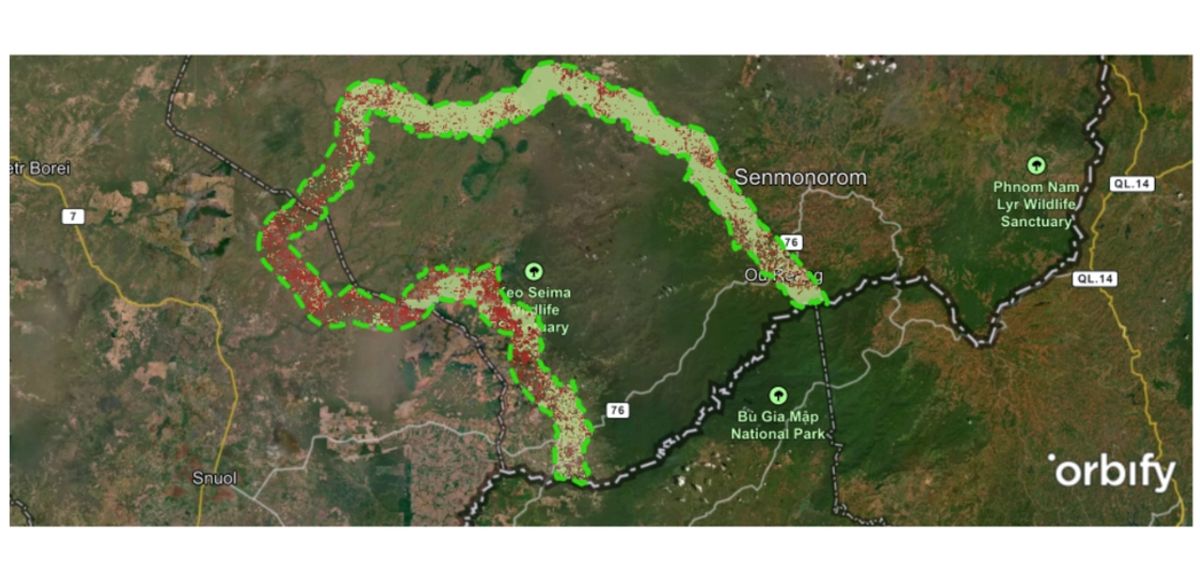
Figure 6: The area we used to represent the leakage area as described in the project description. THe red areas represent forest loss. There is a clear indication that forest loss is localised to the western edge.
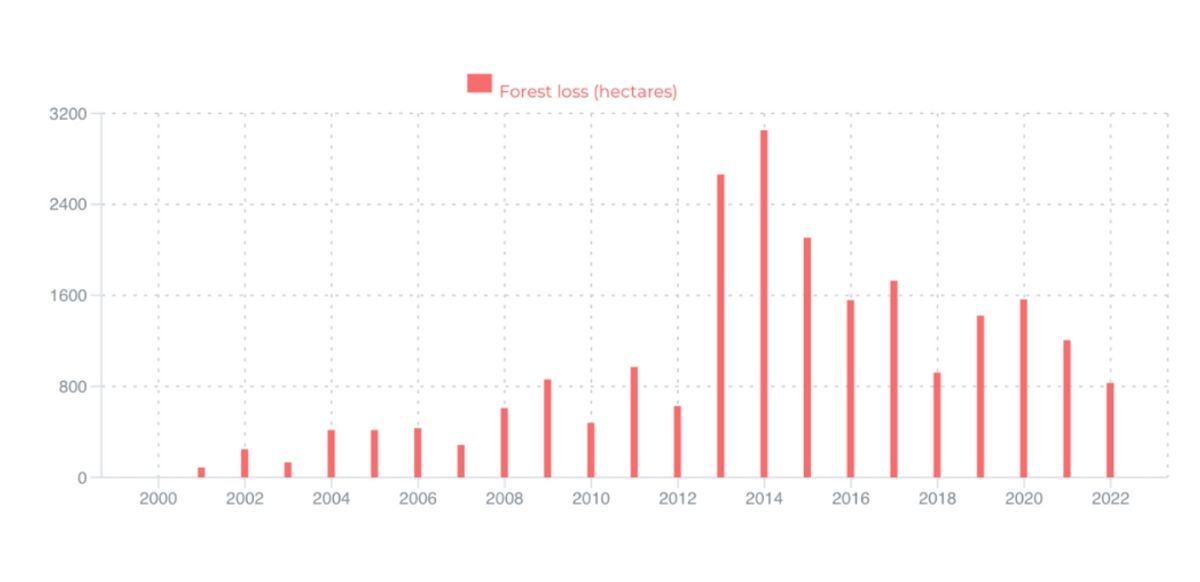
Figure 7: Forest loss in the Leakage area, with deforestation appearing to increase after the project start date (2010).
Whilst the Leakage area used in this report is not identical to the one used in the project description, it is clear that there is still large amounts of forest loss in this area. Deforestation within the leakage area may be caused by displaced activities within the project area, but this could also be due to changes in the management status of lands within this area. The project description says ‘Some parts of the Leakage Belt applicable from 2010 became unavailable for unplanned deforestation from 2012 onwards due to the presence of active Economic Land Concessions.’ This may be the reason for increased deforestation observed around this time.
Reference Area
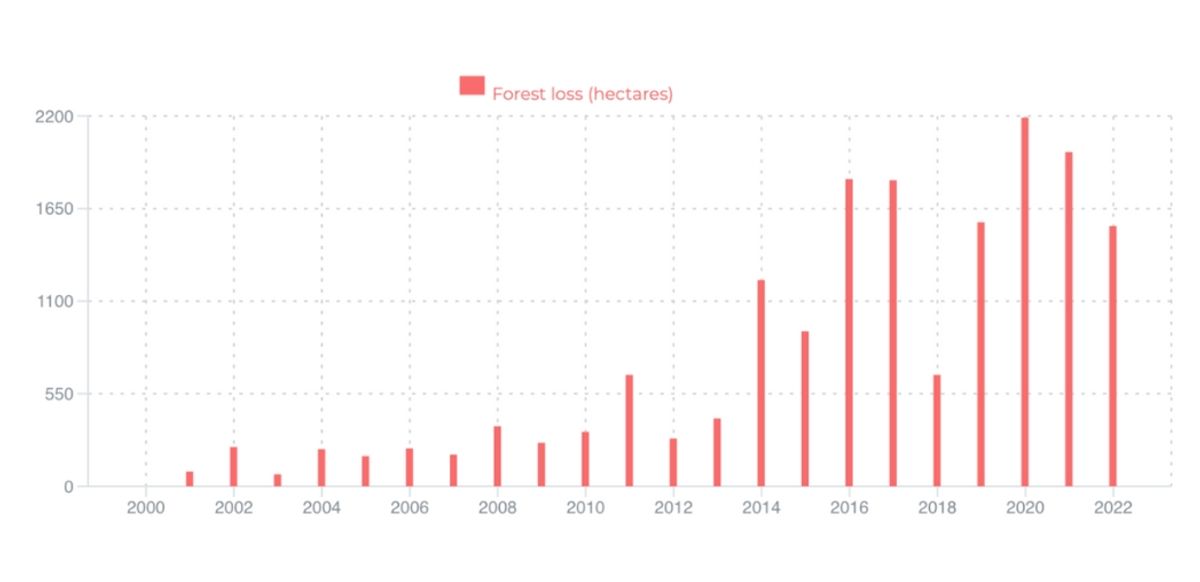
Figure 8: The forest loss for the reference area since the project 2001.
The reference area is the largest area we analysed. It is clear that deforestation has increased within these areas, with the annual forest loss increasing over time (Figure 8).
The project start date is 1 January 2010. To generate ex-ante projections of forest loss, a historic reference period of twelve years (from 1 January 1998 to 31 December 2009) was used. The project describes the baseline scenario to be accelerated unplanned deforestation from smallholder farmers, mitigated by continued grant-funded conservation activities at declining levels.
The project description provides an analysis of historical deforestation, and projections of deforestation from the year 2010 for the project area, leakage belt and reference zone. These projections are derived from linear models based on historic forest loss within the reference zone. We used the Orbify platform to compare the historical and projected forest loss to the Global Forest Loss dataset.
- Project Area:
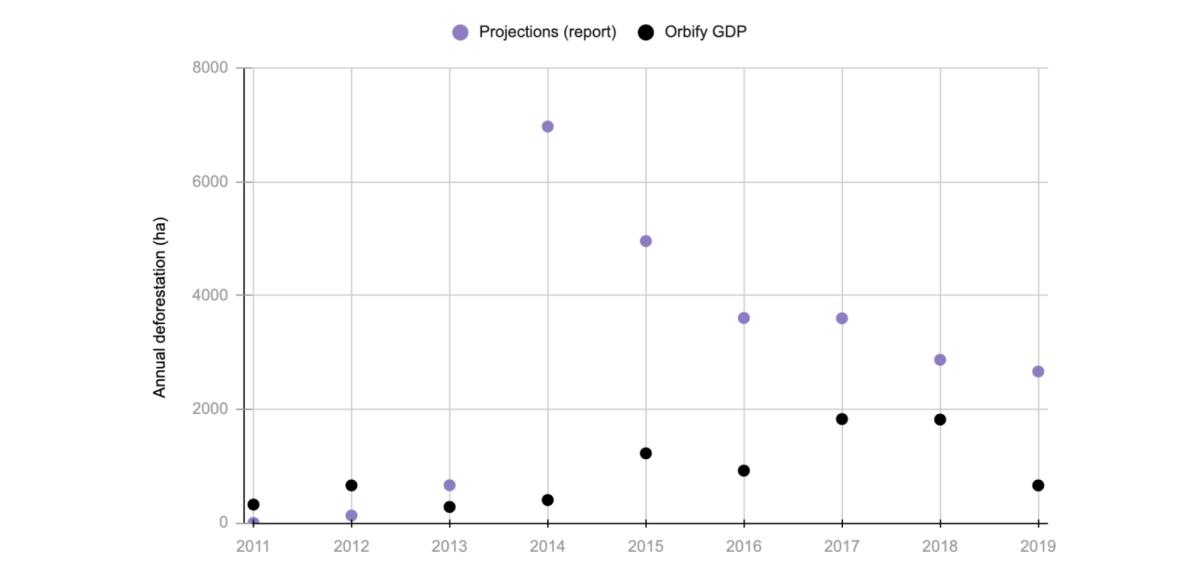
Figure 9: The projected deforestation as provided by the report (purple) vs deforestation via the Orbify GDP
Figure 9 shows that the deforestation within the project area is below the ex-ante projections for the project area as provided by the report. The project documentation suggests a large increase in deforestation in 2013, due to an increase in deforestation from a different forest type (open forest). The observed deforestation is much lower than that of the projected deforestation, but it is not at zero. This suggests that the area still faces significant deforestation pressure and that activities in the area may not be 100% effective.
- Reference Zone:
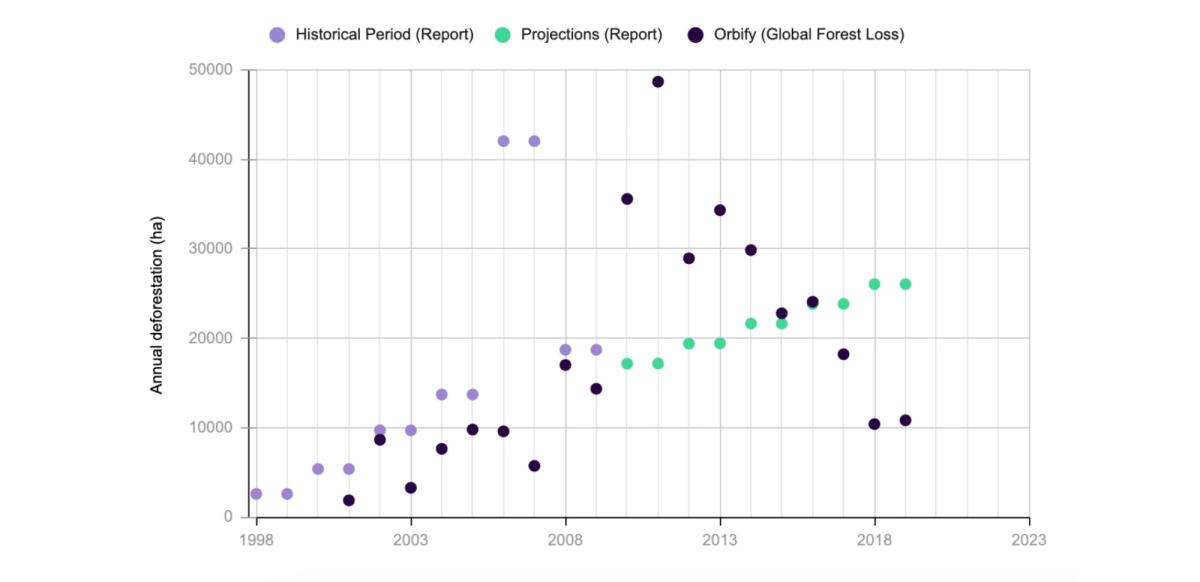
Figure 10: The historical annual deforestation, and the projection for the reference region compared to observed deforestation on the Orbify platform. Note, the report gives the deforestation every 2 years, and so the annual deforestation rates shown here are these divided by two.
Figure 10 shows that the observed deforestation rate in the historical period is reduced compared to that provided by the report, but there is relatively good agreement between the report and the observed values. The projected deforestation is not matched by the observed deforestation, with the observed deforestation remaining significantly higher before 2015, and lower after 2017. It seems that the drivers of deforestation within the reference areas might have changed since the project inception.
In conclusion, it appears that this project still faces large challenges with respect to reducing deforestation rates within the project area. Here, we used the Orbify platform to analyse some of the claims made by the project description, and see in what way the project has been able to fulfil its goals. We can also use the visualisation tools to inspect where the deforestation is occurring within the project areas. The Orbify platform can be used to achieve much more in depth analysis, including providing information on the likely above ground biomass and canopy height of the forest.
Project Source: Project Description 1650