Last edited: August 9, 2024
Published: May 28, 2024

Orbify
Earth Intelligence Specialists
Blog Post
Last edited: August 9, 2024
Published: May 28, 2024
Orbify
Earth Intelligence Specialists
At Orbify, we conduct thorough reviews of Natural Based Solution (NbS) projects related to the Voluntary Carbon Market (VCM), sourced from reputable registries. Using Orbify's platform, we showcase the most efficient and transparent ways to analyze these projects.
Our platform empowers stakeholders by leveraging advanced geospatial data to assess the feasibility and validity of carbon projects. This ensures accurate data for both carbon project developers and buyers. We aim to provide transparent, cost-effective, and timely insights for impactful climate change mitigation strategies. Through our platform, users can make informed decisions, optimizing their climate strategies with confidence.
Our objective is not to rate or advise on investment opportunities but to demonstrate how our platform can be used to analyze projects of interest.
For this review, we have chosen The Suruí Forest Carbon Project, which aims to consolidate forest conservation in the Indigenous Territory Sete de Setembro (TISS) through financial incentives from REDD+ and Payments for Ecosystem Services. The project seeks to reduce projected deforestation by at least 90% and prevent at least 12,217.8 hectares of tropical forests from being cleared by 2038, generating 7,423,806.2 t CO2e of emission reductions.
The Suruí Forest Carbon Project (PCFS) began on June 9, 2009, when the Memorandum of Understanding was signed between the clans, marking the start date of the project. This date coincides with the start of the project's crediting period, which spans 30 years and ends on June 9, 2038. The project aims to halt deforestation and associated greenhouse gas emissions in an area under intense deforestation pressure in the Traditional Indigenous Territory of the Suruí (TISS).
The PCFS is designed to prevent deforestation and promote sustainable land use practices in the territory of the Paiter Suruí indigenous people. The goal is to reduce greenhouse gas emissions and increase carbon stocks in the region. The project activities focus on forest protection, environmental conservation, food security, sustainable production, capacity building, and the development and implementation of a financial mechanism known as the Suruí Fund.
VCS Project Type: The project falls under the category of AFOLU (Agriculture, Forestry, and Other Land Use) activity, focusing on forest protection, environmental conservation, food security, sustainable production, and institutional strengthening.
VCS Methodology: The project employs the Avoided Unplanned Deforestation (AUD) methodology, specifically VCS VM0015 version 1.0 (VM0015 v1.0), adhering to the defined spatial domains, baseline, and project scenarios.
Hectares: The project aims to prevent at least 12,217.8 hectares of tropical forests from being cleared by 2038.
Description: The project leverages a range of social benefits, including the generation of new income sources through sustainable alternatives, job creation, health improvement, education, and the preservation of the Paiter Suruí’s culture and cosmology.
Benefits to Climate: The project aims to generate 7,423,806.2 t CO2e of emission reductions and contribute to the maintenance of the ethno-environmental corridor, which encompasses several indigenous lands and conservation units.
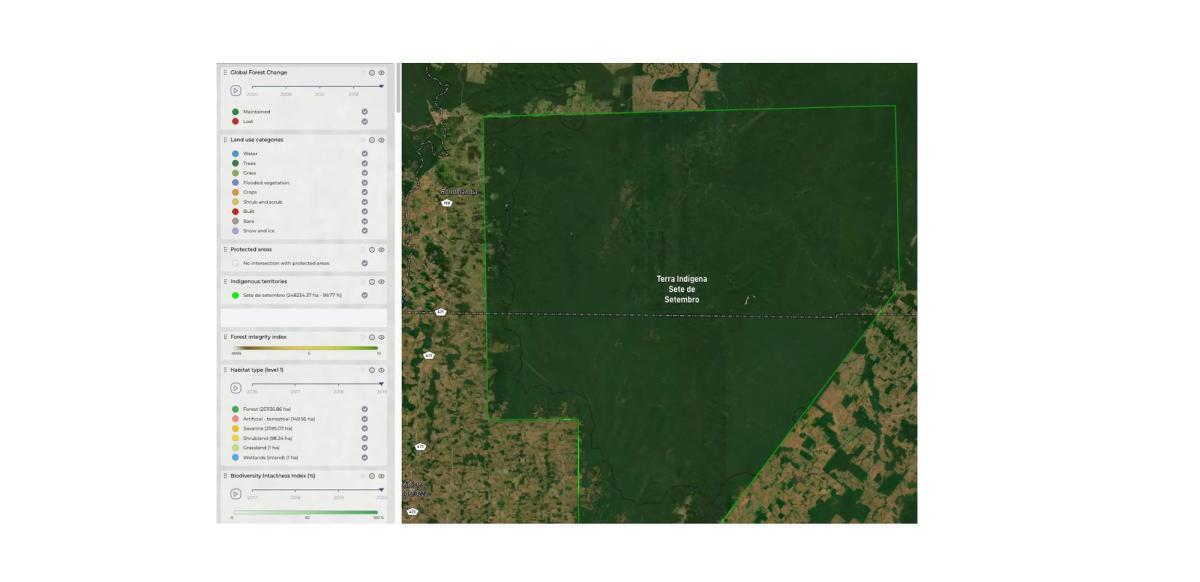
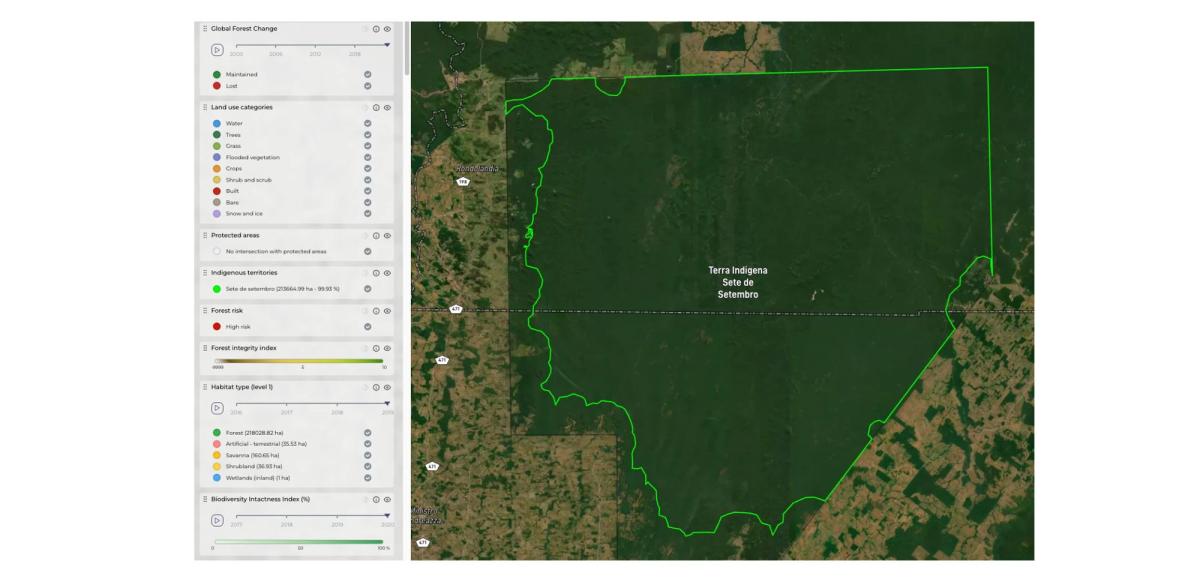
To begin this review, we will start by analyzing the project area and defining it based on the registration documents. The Project Area within the Suruí Forest Carbon Project encompasses the forest extension within the TISS that would be deforested in the baseline scenario. This area is expanded by a 1 km buffer allocation, aiming to prevent deforestation, totaling 31,994.2 hectares. By uploading this project area to our platform, Orbify can measure the provided area more accurately, taking into account the elevation.
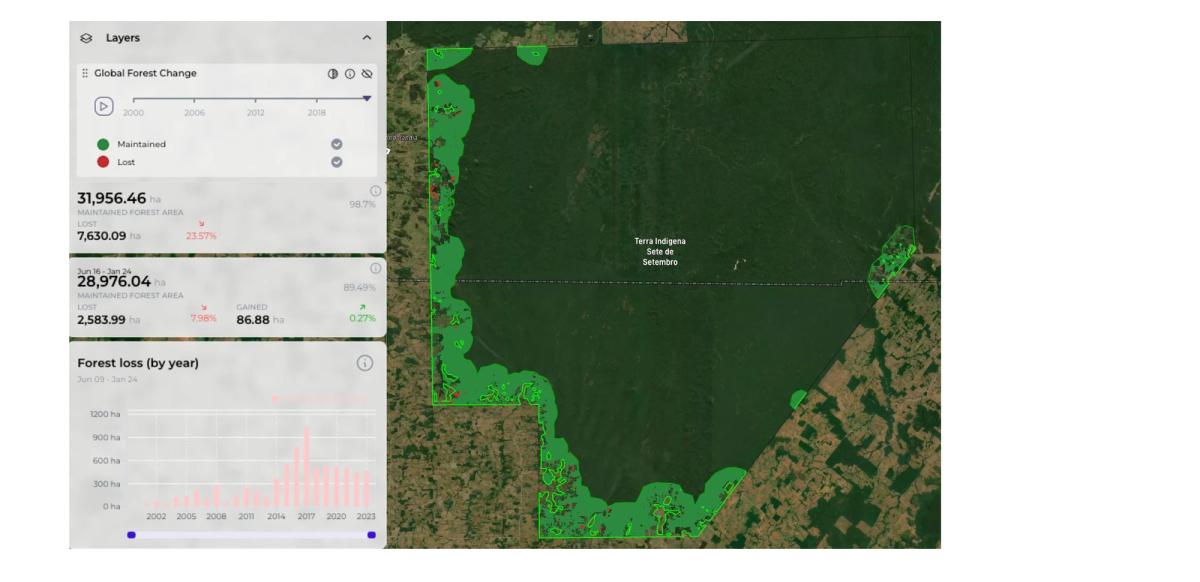
After defining the project area, examining historical deforestation is critical for any carbon project. Historical forest loss is significant for REDD+ project assessments because it indicates the extent of deforestation and degradation that would have occurred without intervention. This historical context is essential for accurately measuring the impact of REDD+ projects in terms of emissions reductions and carbon sequestration, ensuring that incentives and funding are directed effectively towards preserving forests and mitigating climate change.
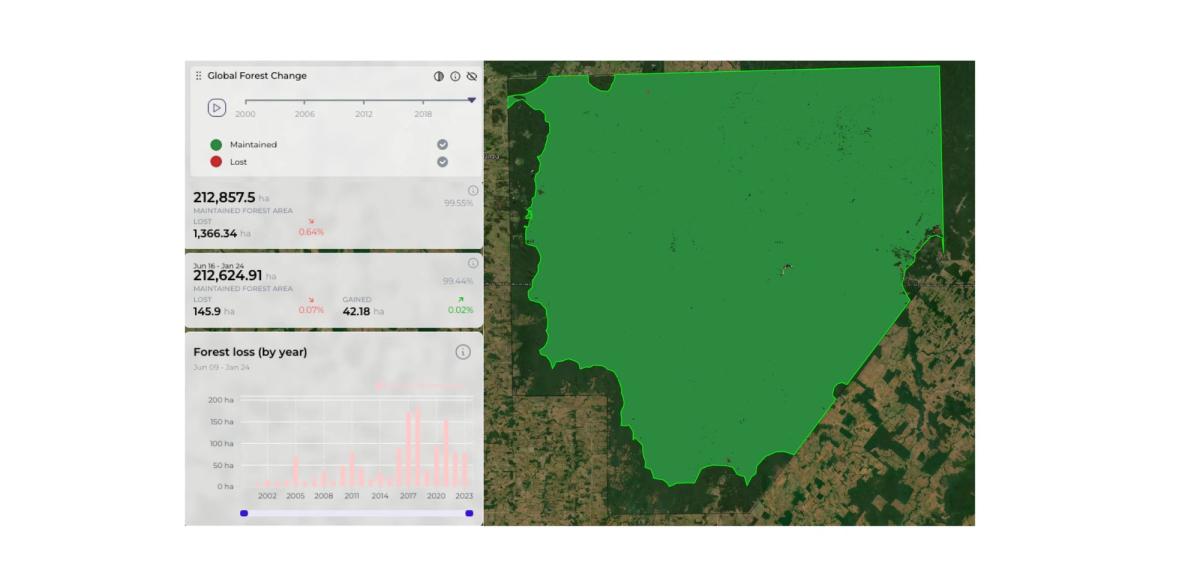
Based on the Registration Project Document, the historical deforestation of the project area within the Suruí Forest Carbon Project (PCFS) is detailed extensively. The analysis of historical land use between 2000 and 2009 showed that 1,415.8 hectares were deforested in the Suruí territory during that period, totaling 3,416.6 hectares of deforestation accumulated in Anthropic Vegetation. The average annual deforestation between 2001 and 2009 was 157.4 hectares, with a clearly increasing trend during that period. From 2001 to 2004, the average deforestation rate was 142.9 hectares per year, while from 2005 to 2009, the average deforestation rate was 168.9 hectares per year. The total deforestation in the period 2005 to 2009 was 844.4 hectares.
To examine the historical deforestation of this carbon project, we added the project area data into Orbify’s platform and analyzed deforestation based on the registration document. Orbify allows you to visualize deforestation claims by providing detailed geographical information on deforestation events. Additionally, our platform enables you to track historical deforestation year by year, offering a clear and comprehensive view of deforestation trends over time. This functionality ensures accurate monitoring and better understanding of the impact and progression of deforestation within the project area.
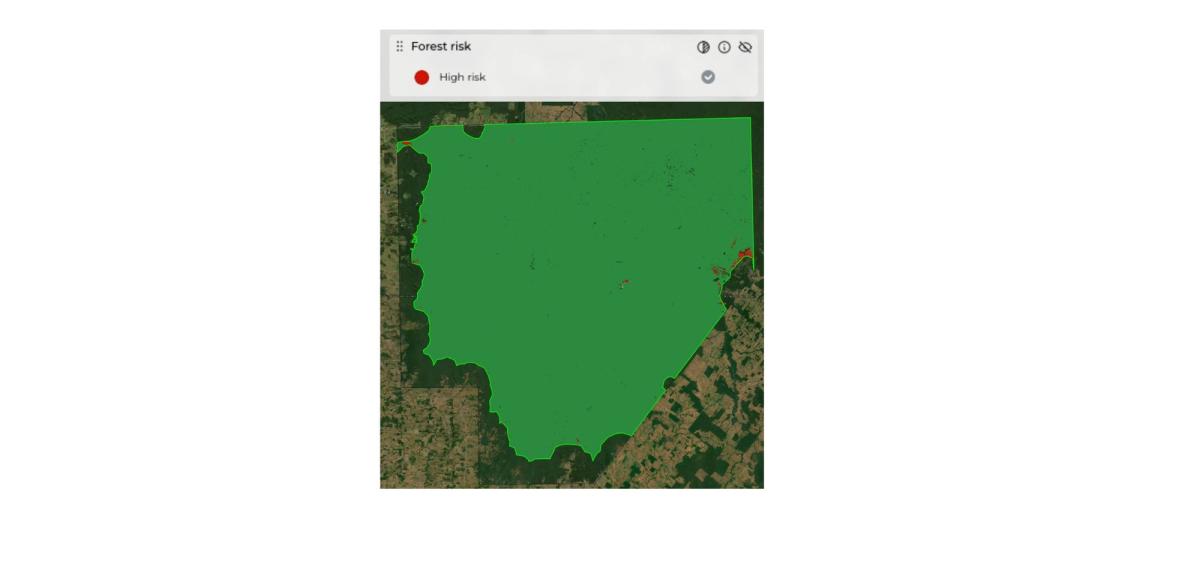
After examining the historical deforestation, it is also important to analyze the deforestation risk, which is the primary risk in REDD+ projects. This risk involves the possibility of continued or increased deforestation and forest degradation in the project area due to factors such as illegal logging, agricultural expansion, infrastructure development, or changing land-use patterns.
Based on the Registration Project Document:
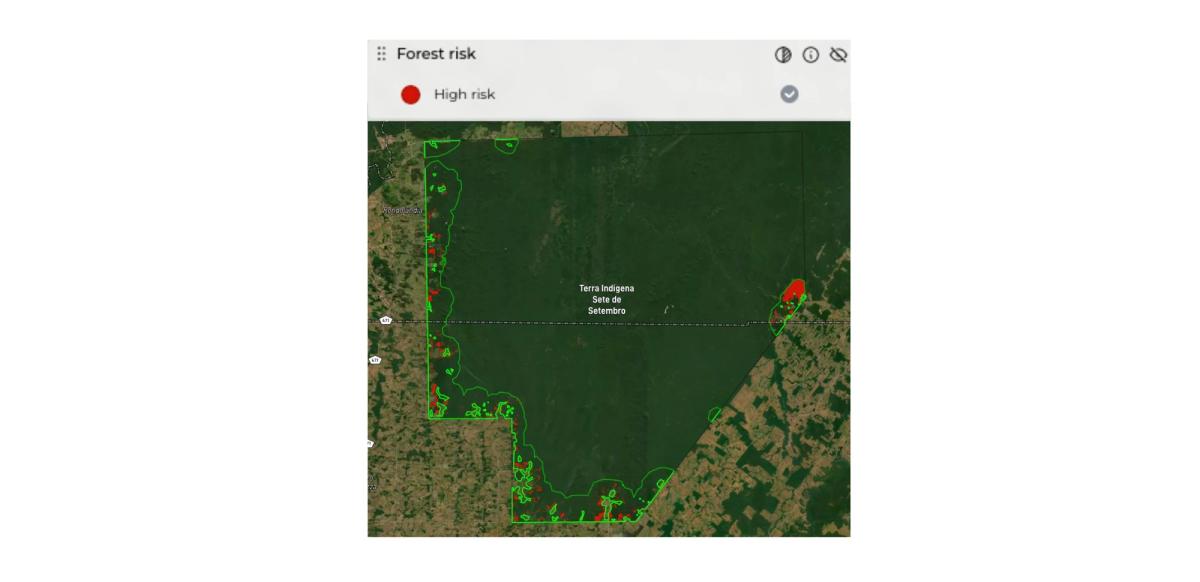
Maximum Potential Deforestation: The document indicates that the maximum potential area of deforestation in 2009 is 38,956.25 hectares, which is 248 times greater than the historical annual rate of deforestation observed from 2000-2009. This substantial potential for deforestation indicates a high level of forest risk in the reference area.
Influential Biophysical Drivers: The document identifies influential biophysical drivers of deforestation, including the distance to roads, villages, previously deforested areas, and urban areas, as well as the type or sub-class of vegetation. It discusses the influence of each of these biophysical variables on the distribution of deforestation from 2000-2009 and builds a map indicating the probability of deforestation for 2009 based on these variables. The map of maximum potential deforestation presents positive values indicating areas that exhibit conditions favorable for conversion to non-forest areas. The resulting area of maximum potential deforestation is calculated to be 38,956.25 hectares, indicating a high level of forest risk.
Projection of Future Deforestation: The document projects the quantity of future deforestation, indicating that the annual rate of deforestation observed over the period 2000-2009 is increasing. The evidence suggests that these rates may be higher still in the future, further emphasizing the high forest risk in the reference area. Based on these points, the forest risk of the reference area can be categorized as high.
It is important to note that the document does not explicitly mention the specific deforestation risk only for the Project Area.
To examine the deforestation risk we used Orbify’s platform as it offers the ability to address the deforestation risk specifically in the Project Area, in contrast to past approaches which were broader. The Forest Risk is a score built from various factors describing the overall risk to the forest. Each factor is assessed individually, and their correlation with deforestation is determined. These correlations are then used to weight the importance of each factor, ensuring that the final index is a balanced representation of all contributing risks.
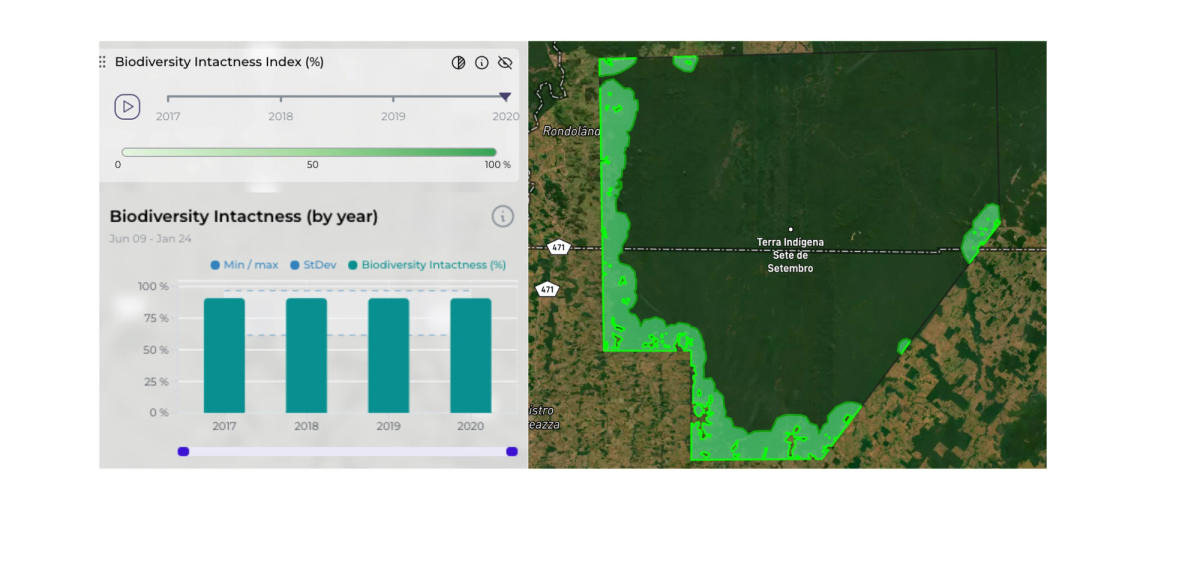
After examining deforestation, it is also important to investigate other critical variables of a carbon project, such as biodiversity indicators. The project outlines a plan to ensure net positive impacts on biodiversity in the project area and to monitor the biological diversity that may still be threatened by the project. This includes sensitizing community members about the importance of monitoring the use of natural resources, training community members to operate as biodiversity monitors, and monitoring species used by the local communities, including synergetic fauna and timber and non-timber forest products. The project's plan also involves monitoring species of special interest, including endangered or critically endangered species, endemic species, and species that cause economic losses to communities.
At Orbify, we quantify human impact on species communities' intactness. Anthropogenic pressures, such as land use conversion, have dramatically altered species compositions. Our platform illustrates these changes by focusing on the impact of forest change on biodiversity intactness from carbon projects. Additionally, our Orbify has the advantage of being able to calculate and visualize biodiversity intactness annually. The screenshot below shows the project's biodiversity intactness, a crucial component when reviewing a carbon project.
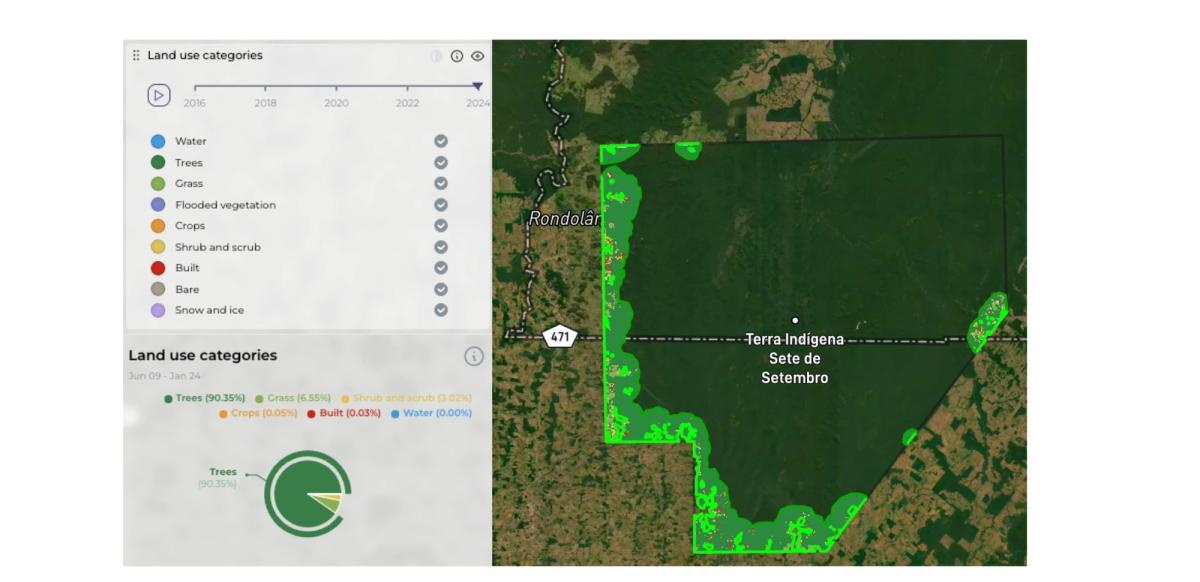
Another important component to examine when reviewing a carbon project is how the land of project area is actually used. When it comes to land-use categories, the project presents a comprehensive list of land use and land cover classes existing at the project start date within the reference region. These classes are identified with unique identifiers and are associated with specific trends in carbon stock, presence in the baseline activity, and descriptions of the land use and land cover classes. The classes include “Degraded Ombrophyllous Forest,” “Anthropic Vegetation in Equilibrium,” and “Non-forest,” each with distinct characteristics and implications for carbon stocks and land use change.
Addressing and analyzing the land use categories within the project area through Orbify’s platform provides invaluable insights. At Orbify, we not only identify nine distinct land use and land cover categories but also track the changes between them annually (2016-2024). This capability allows for a thorough understanding of how land use transitions impact carbon stocks and overall environmental health. By visualizing these changes, stakeholders can make informed decisions about conservation strategies, carbon stock management, and sustainable land use planning. This comprehensive approach ensures that all aspects of land use and land cover are considered.
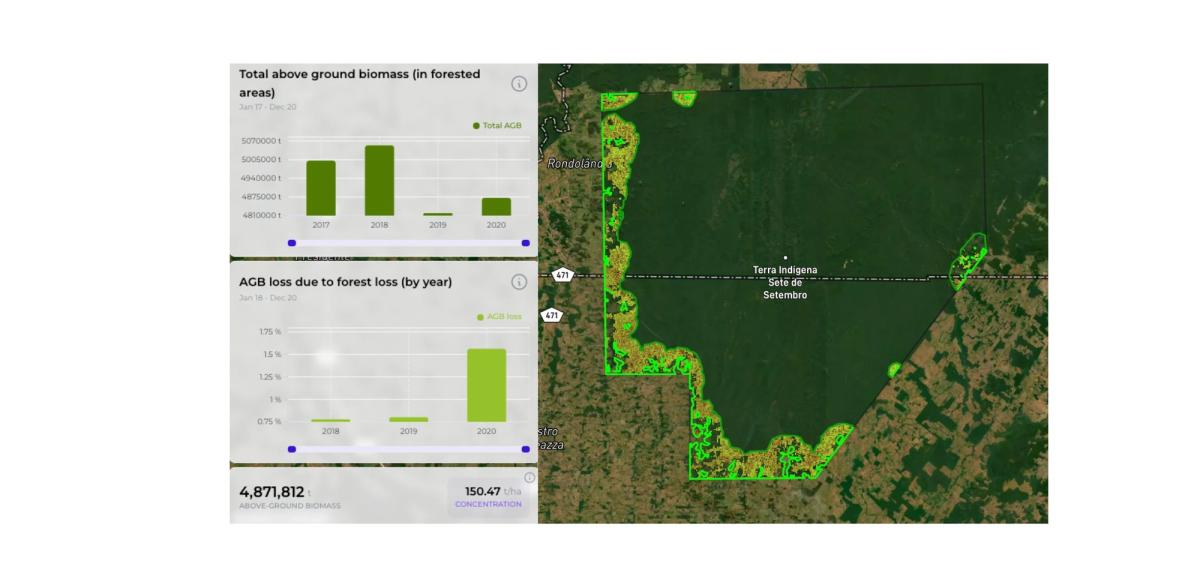
After these analyses, it is also crucial to review the above-ground biomass (AGB) of the project area based on their registration document. An inventory of forest biomass was conducted between 2010 and 2011, sampling 22 hectares of Degraded Ombrophyllous Forest in the TISS, across three forest vegetation types or sub-classes: Open Ombrophyllous Forest with Lianas (FAC), Open Ombrophyllous Forest with Palmeiras (FAP), and Dense Ombrophyllous Forest (FD). The forest inventory involved measuring all plants—trees, palms, and lianas—with a diameter at breast height (DBH) ≥ 10 cm (or circumference at breast height - CBH ≥ 31.4 cm) to estimate the above-ground biomass. Allometric equations were used to determine the dry weight of the measured plants, and the indigenous names of plants were noted for the permanent plots.
Carbon Stock in Aboveground Biomass: The project provides a value of 128.72 tons of carbon per hectare in aboveground biomass within the forest degradation class in the TISS. This value was obtained from the forest inventory conducted by IDESAM, ACT, and Metareilá, using allometric equations to estimate the total above-ground biomass. The document also mentions the use of a root-shoot ratio to estimate below-ground biomass.
Monitoring Changes in Carbon Stocks: The document outlines a monitoring plan that includes the task of tracking actual changes in carbon stocks in the project area. This responsibility falls to ACT Brazil, Kanindé, Metareilá, and other indigenous associations. The monitoring plan aims to oversee the implementation of the project, monitor leakage, conduct ex-post calculations of GHG emission reductions, and assess the impacts of natural disturbances and other catastrophic events on carbon stocks.
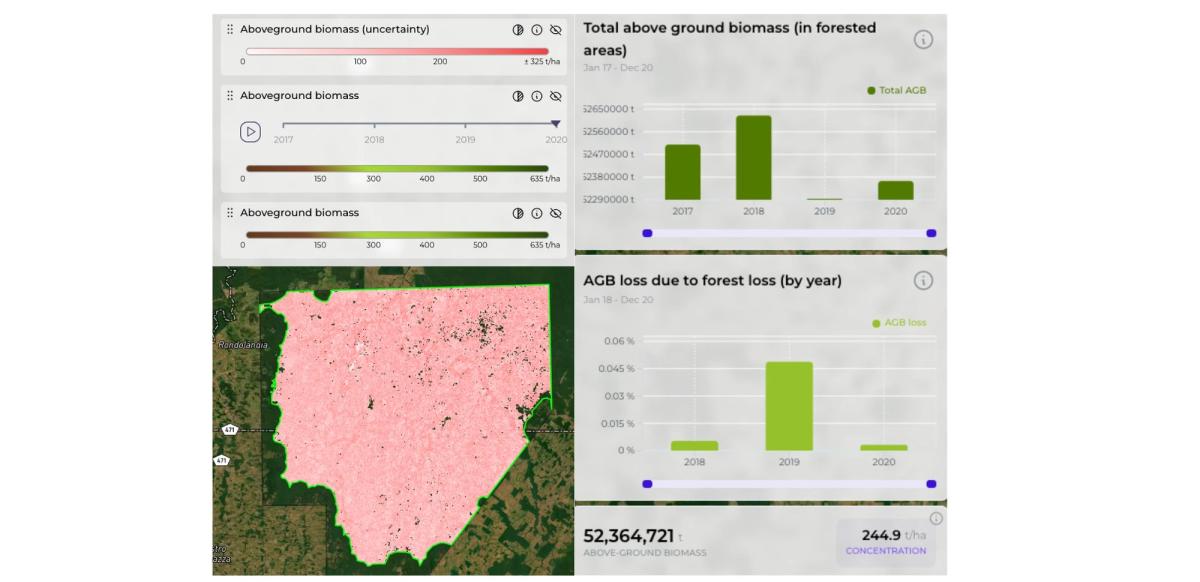
At Orbify, we leverage satellite data to assess AGB, providing measurements for the entire area rather than relying on samples. A significant advantage is that our analytics can address the total AGB specifically in the Project area. Changes in AGB can be monitored from our analytics (annually), eliminating the need for indigenous associations to perform this task.
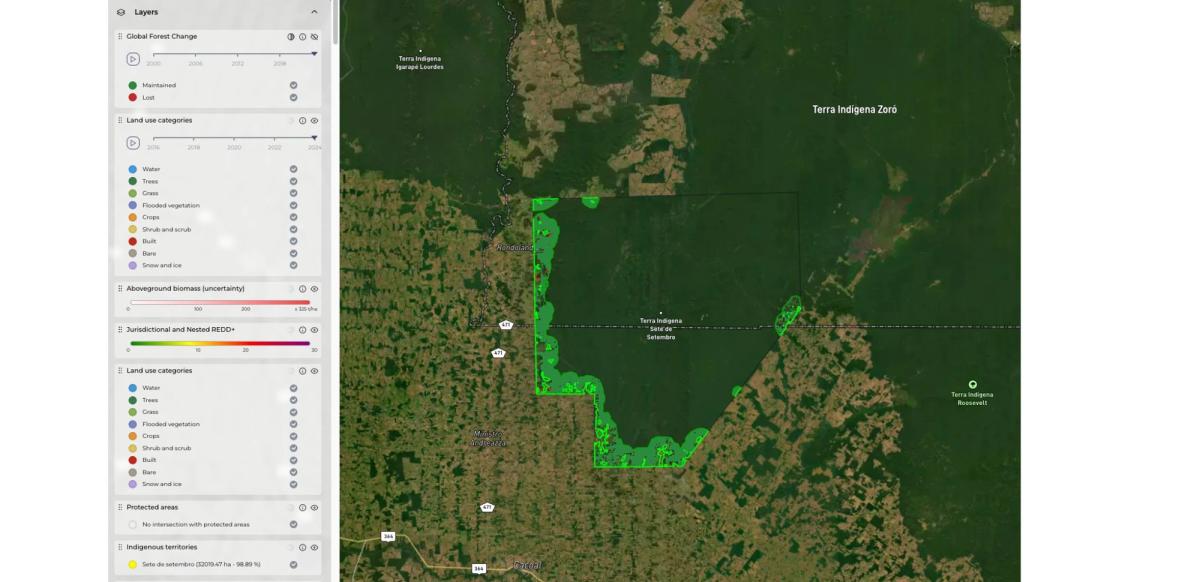
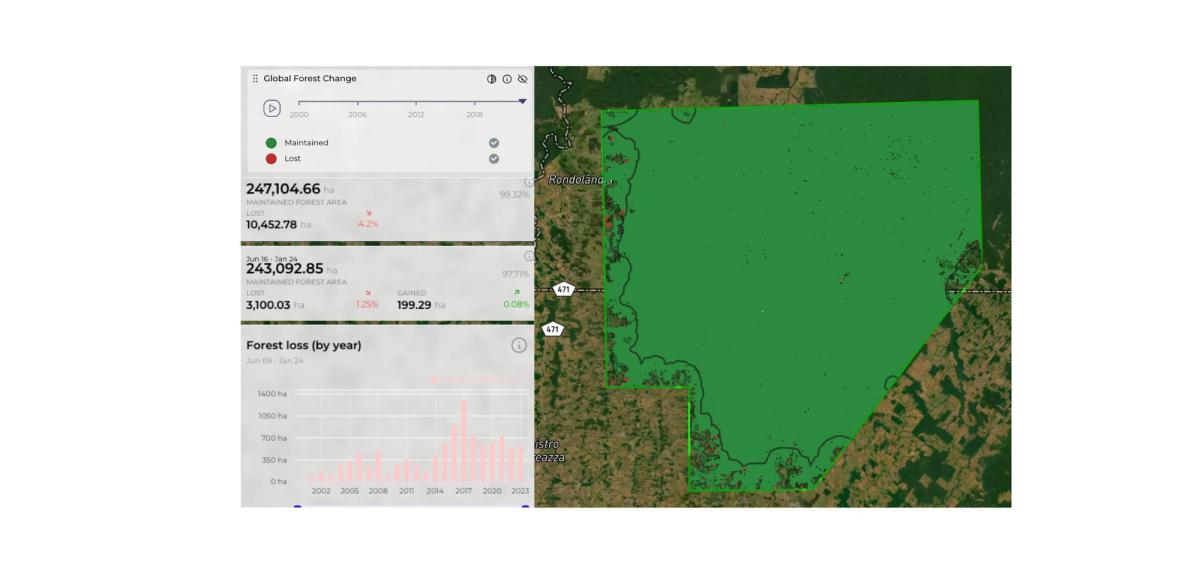
The Reference Region is defined as the area of the Traditional Indigenous Territory of the Suruí (TISS), which is a spatial unit legally recognized by the Brazilian federal government, covering 247,845 hectares. The TISS was chosen because it best represents the conditions related to land use and change, including historical rates of deforestation, the presence of the Paiter-Surui indigenous people, socioeconomic and cultural conditions, and landscape configuration and ecological conditions.
The entire reference region is exclusively used by the Suruí people, who are themselves the sole agents of deforestation. It has the same forest class (degraded Ombrophyllous Forest) as the rest of the reference region. The reference region is used as a baseline for comparison and monitoring of changes in land use and deforestation. It provides a context for evaluating the impacts of the project activities on the surrounding area.
Based on the registration document the historical forest loss in the reference area, specifically within the Suruí territory, between 2000 and 2009 was 1,415.8 hectares, totaling 3,416.6 hectares of deforestation accumulated in Anthropic Vegetation. This analysis of historical land use during that period revealed the extent of deforestation within the Suruí territory. The deforestation data is crucial for understanding the baseline conditions and historical rates of forest loss in the reference region, which is essential for the Suruí Forest Carbon Project’s monitoring and evaluation efforts.
Additionally, the reference region is exclusively used by the Suruí people, who are themselves the sole agents of deforestation within the reference region. This underscores the significance of monitoring and addressing deforestation within the Suruí territory to achieve the project’s objectives of preventing further forest loss and reducing greenhouse gas emissions.
Therefore, the historical forest loss in the reference area, particularly within the Suruí territory, provides important context for the project’s monitoring and verification activities, as well as for assessing the impact of the Suruí Forest Carbon Project on reducing deforestation and promoting sustainable land use practices in the region.
To obtain results regarding the historical deforestation, we added the reference area data into our platform to compare our findings with those in the registration document. As a key player in the field, Orbify facilitates annual monitoring of deforestation, providing insights based on trustworthy, peer-reviewed datasets.
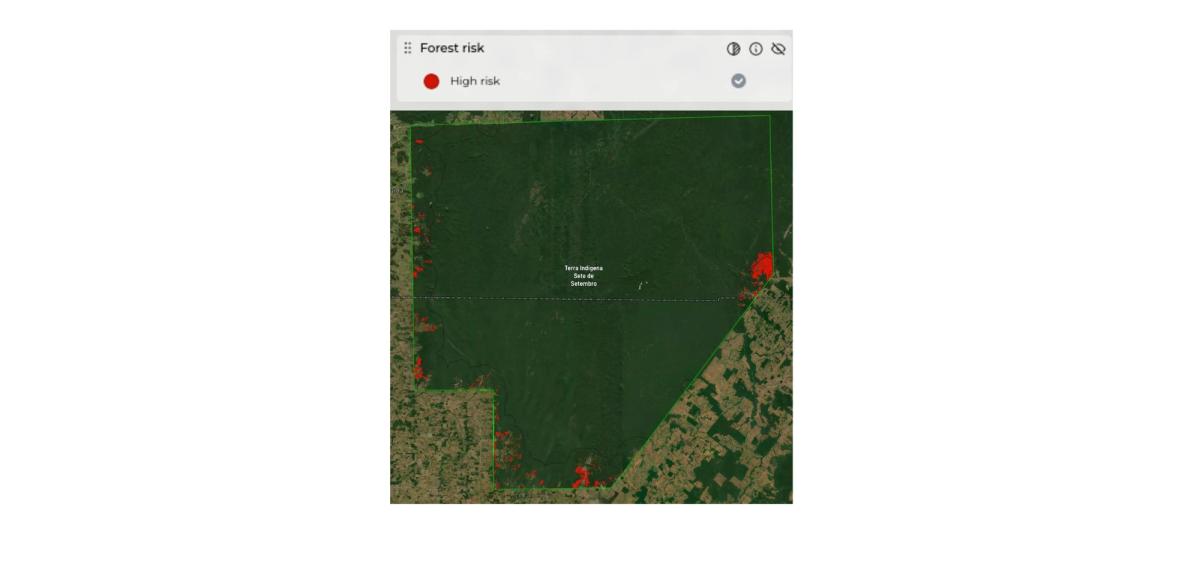
To investigate the deforestation risk using our platform, we added the reference area of the carbon project. The Forest Risk score is constructed from various risk factors, each assessed individually. Their correlation with deforestation is determined and used to weight the importance of each factor. This ensures that the final index is a balanced representation of all contributing risks, providing a comprehensive assessment of deforestation risk in the project area.
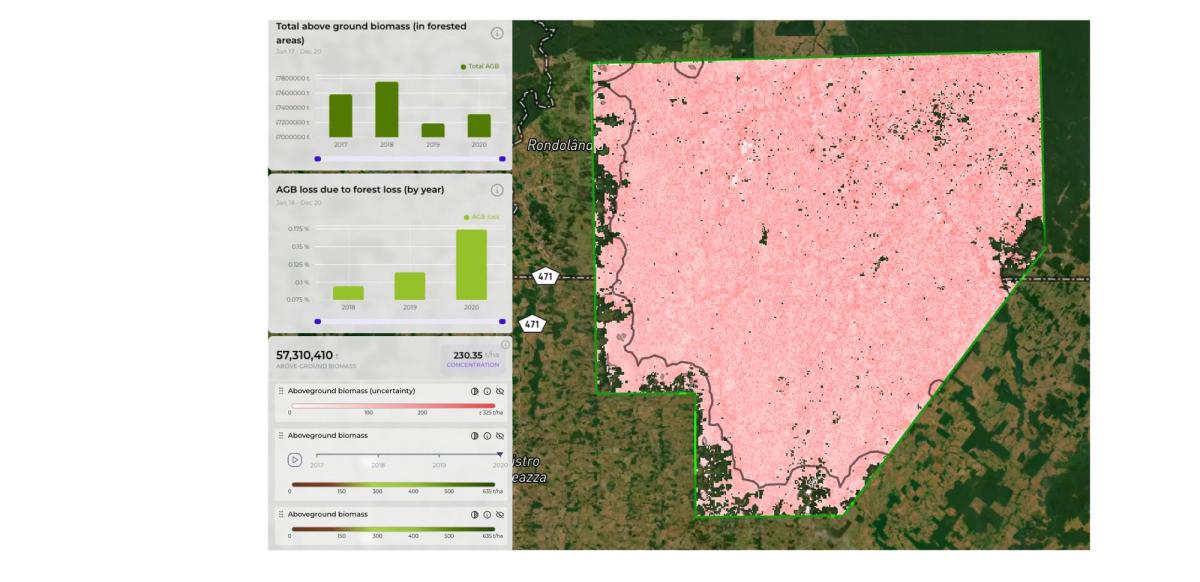
To investigate the Above-Ground Biomass (AGB) of the reference area, we added the reference area data into our platform. By addressing AGB, we obtain comprehensive annual measurements for the entire area rather than relying on samples. According to our analytics, the total AGB is 230.35 t/ha. Changes in AGB can be monitored annually using our platform, allowing for year-to-year comparisons. This capability eliminates the need for manual efforts by indigenous associations and provides clear insights into how AGB evolves over time, helping to track the effectiveness of carbon project interventions.
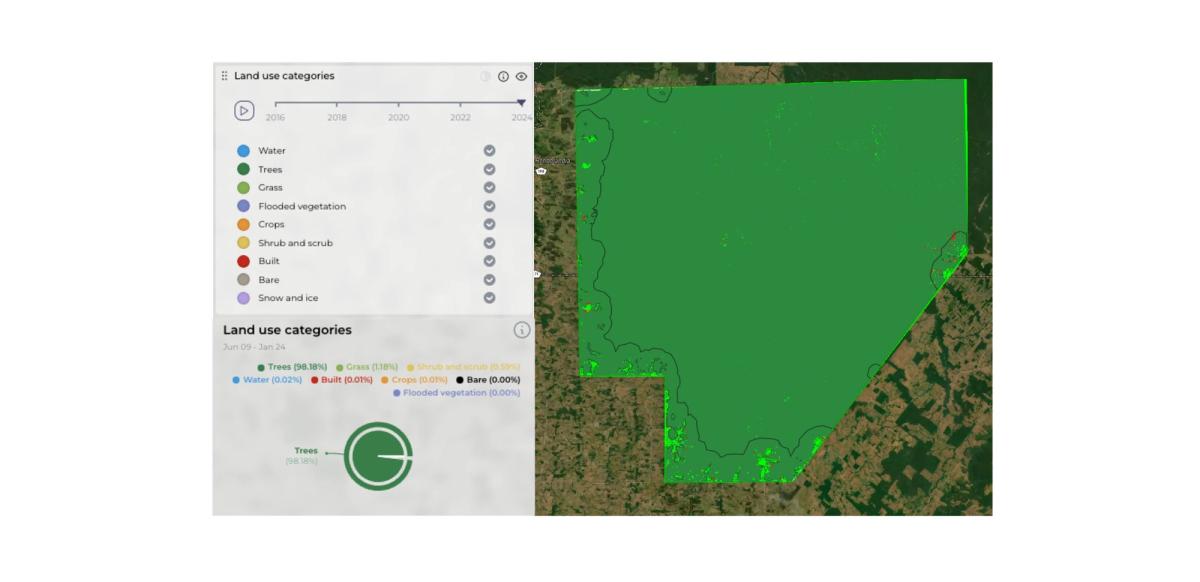
As we did in the project area analysis, we conducted the same land use analysis for the reference area based on their registration documents. Our analysis can address not only nine distinct land use categories but also track the changes between them throughout 2016-2024. Additionally, with our analysis, you can obtain the annual land change data for both the land and project areas. This is crucial for reviewing a carbon project as it provides insights into land use dynamics and their impact on carbon stocks.
The Suruí Forest Carbon Project (PCFS) includes a Leakage Belt, an area at risk of deforestation surrounding the project area within the Sete de Setembro Indigenous Land (TISS). The Leakage Belt is defined based on the methodology VM0015 v1.0, which includes a mobility analysis to identify areas that could be deforested by the Paiter Suruí. It is important to note that the Leakage Belt is considered in the context of potential leakage due to activity displacement and external factors.
The Leakage Belt is a critical component of the project’s strategy to prevent increases in greenhouse gas emissions outside the boundaries of the project area. It is designed to encompass areas where potential deforestation and carbon stock changes may occur as a result of activity displacement or external factors. The purpose of identifying the Leakage Belt is to assess the overall impact of the project on preventing deforestation and managing carbon stocks in the broader reference region.
According to the project’s methodology, the Leakage Belt is expected to include areas that could be deforested by the Paiter Suruí, making it an essential consideration for addressing potential leakage associated with activity displacement. The total area of the Leakage Belt is specified as 208,038.9 hectares, playing a crucial role in the project’s efforts to prevent deforestation and manage carbon stocks within the TISS and the broader reference region.
According to the project’s methodology, the Leakage Belt is expected to include areas that could be deforested by the Paiter Suruí, making it an essential consideration for addressing potential leakage associated with activity displacement. The total area of the Leakage Belt is specified as 208,038.9 hectares, playing a crucial role in the project’s efforts to prevent deforestation and manage carbon stocks within the TISS and the broader reference region.
Upon reviewing the project document, we find that the Leakage Belt is mentioned in several sections, including the description of the project area, the surrounding project zone, and the leakage management area. However, there is no specific mention of historical deforestation solely within the Leakage Belt. In summary, the Leakage Belt in the Suruí Forest Carbon Project is the area at risk of deforestation surrounding the project area and within the TISS, identified based on a mobility analysis to define potential areas that could be deforested by the Paiter Suruí. It is a key aspect of the project’s strategy to prevent leakage and manage carbon stocks.
To analyze the deforestation risk in the Leakage Belt area through Orbify, we integrated this data into our platform. The Forest Risk score here is also built from multiple risk factors, each evaluated separately. By determining the correlation of each factor with deforestation, we can assign appropriate weights to their importance. This approach ensures that the resulting index accurately represents all contributing risks, offering a detailed assessment of deforestation risk in the Leakage Belt area.
To begin with, when analyzing the Leakage Belt, it is important to note that the registration document does not explicitly mention the specific deforestation risk solely within the Leakage Belt. However, a significant advantage of our platform is its ability to address deforestation risk specifically in this area. To validate the data, we included the Leakage Belt area in our platform and conducted the same analysis as with the previous areas.
The Forest Risk score is derived from various risk factors that describe the overall threat to the forest. Each factor is assessed individually to determine its correlation with deforestation. These correlations are then used to weight the significance of each factor, ensuring that the final index provides a balanced representation of all contributing risks.
Even though we have just data from the reference area based on the registration project document, our platform provides a significant advantage by addressing the AGB specifically in the Leakage area. Using satellite data, we can obtain measurements for the entire area rather than relying on samples. According to our analytics, the total AGB is 244.9 t/ha. Changes in AGB can be monitored using our analytics, eliminating the need for indigenous associations to perform this task.