Last edited: August 9, 2024
Published: October 4, 2023

Orbify
Earth Intelligence Specialists
Blog Post
Last edited: August 9, 2024
Published: October 4, 2023
Orbify
Earth Intelligence Specialists
In the Orbify Review, we pick an NbS project related to the Voluntary Carbon Market from one of the credible registries and review it using our Geospatial Data Platform (GDP) to show how can you use and take advantage of our platform to analyse a VCM project or even to monitor and use the data to include in your PDD on the project development. Here we review a project based on the project description provided in the Verra registry.
For this Review, we've selected FLORESTAL SANTA MARIA located in Mato Grosso state, Brazil. The project is registered on Verra Registry.
The Florestal Santa Maria is a carbon offset initiative developed and registered under the Verified Carbon Standard (VCS) and the Climate, Community. The project aims to combat deforestation in the region by engaging with local communities and implementing various activities to reduce land and forest resource pressures.
The FSM forest estate, a rural property solely dedicated to the sustainable management of natural forests, is located in the Municipality of Colniza, approximately 30 km from the township, in the northwestern region of the State of Mato Grosso, approximately 1,100 km north of the State Capital of Cuiabá. The geopolitical region falls within the Brazilian Legal Amazon. The municipality of Colniza was recently emancipated in 1998, having previously belonged to the municipality of Aripuanã, founded in 1946.
The project development activities consist of creating consistency in the wood supply throughout the entire production chain, from census/extraction to final processing in the city. The project will involve several inclusion actions for neighboring communities through a partnership with the Colniza Municipal Administration to implement technical education programs and communication media (telephone, internet, etc.). Technical qualification, training in forest management, and community development through participative workshops can increase the collective understanding of climate change and the importance of the forest. This understanding is essential for each individual in the process of a collective transformation of cultural relations and the lifestyle of the local community. The FSM REDD Project is committed to conducting social-environmental activities linked to the preservation of forest stewardship and maintaining the integrity of the Santa Maria property.
The proponent and developer of the Project is Florestal Santa Maria S/A. PLANT Environmental Intelligence is technically responsible for this VCS-PD, with contributions from AVIX in deforestation risk analysis and similarity analysis. All legal matters are under the responsibility of Pinheiro Neto Advogados' lawyers. General Coordination for this initiative was carried out by VO2 Desenvolvimento Empresarial.
In conclusion, the FSM Project is an environmentally significant initiative aimed at combating deforestation through collaboration with local communities, governmental bodies, and various stakeholders. By implementing a range of activities and engaging in carbon offset strategies, the project aims to address deforestation pressures in the region, promoting sustainable land use and forest conservation.
In our review, we will assess the three areas mentioned in the PDD: the Project Area, the Leakage Area, and the Reference Area. We are not considering any potential changes in the area since the first PDD submission or the second baseline assessment. Our goal is not to provide ratings or guidance to potential investors but to demonstrate how our platform can be used to analyze the project of interest. If you are interested in project investment consultancy, please contact us.
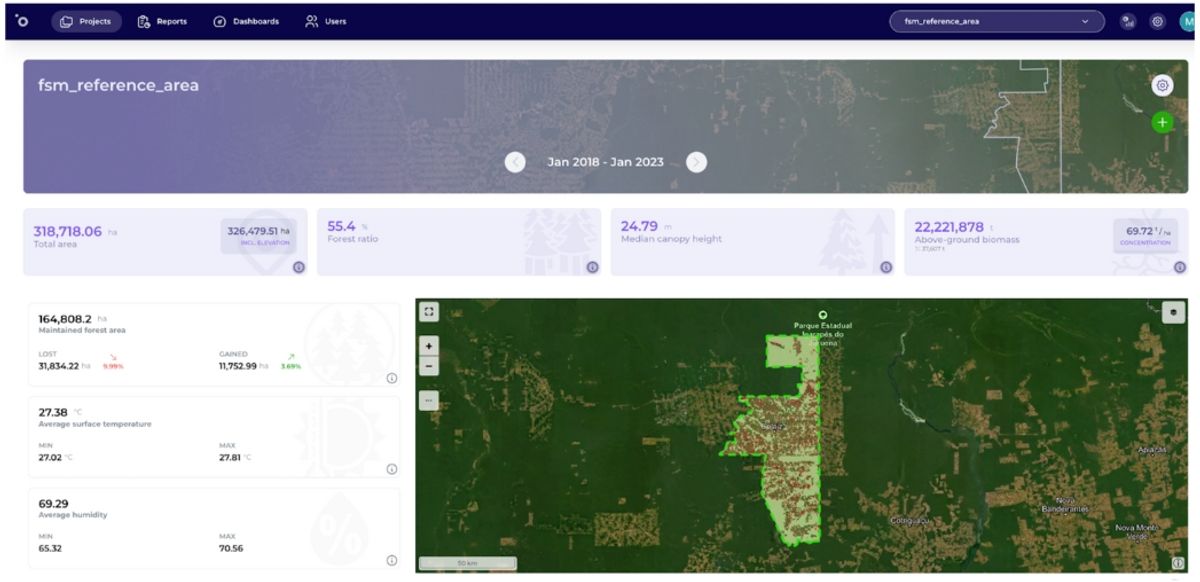
We then uploaded the project area on our GDP and selected the dates of the analysis so we can see the dashboard and map with the indicators. For this particular example, we choose the dates to cover the data from 2020.01.01 until 2023.01.01. Let's have a look at the change analysis derived from GDP:
Total area = 71,958.49 ha - which is 99.66% similar to the project area of the PDD.
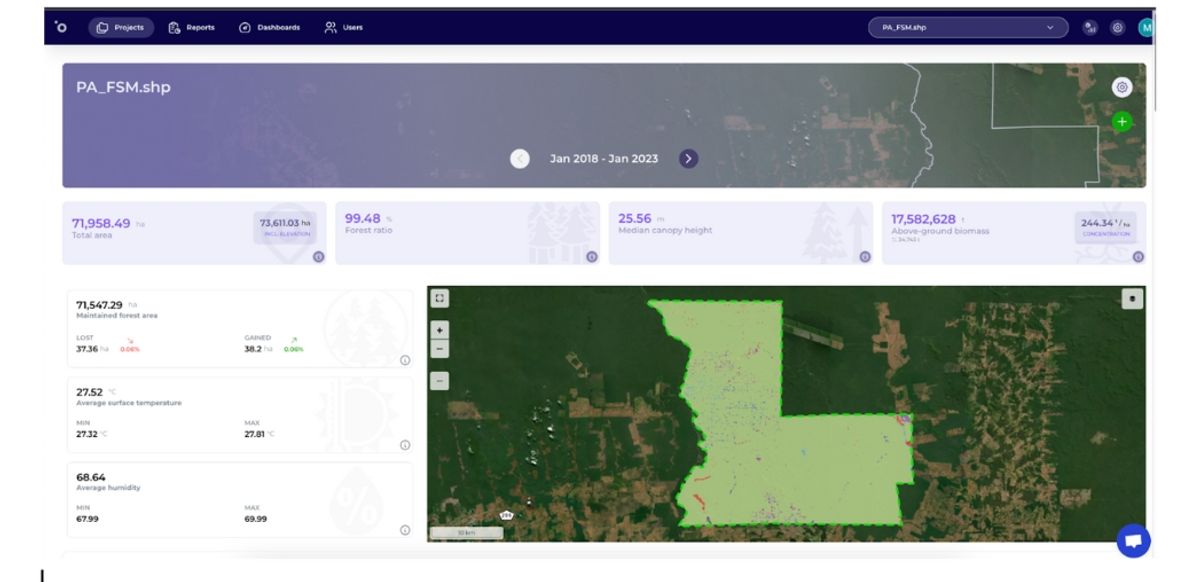
By analyzing the data, it is possible to observe the extent of maintained forest and the levels of deforestation and degradation in the area. Interestingly, this region is situated in a high-threat zone for deforestation but has achieved notable success in curtailing clear-cutting within its boundaries.
The data reveals the presence of sustainable logging activities in the area, along with certain sections where efforts to prevent deforestation have not been entirely effective in recent years. These areas are represented by the scattered 'pixels' dispersed throughout the region.
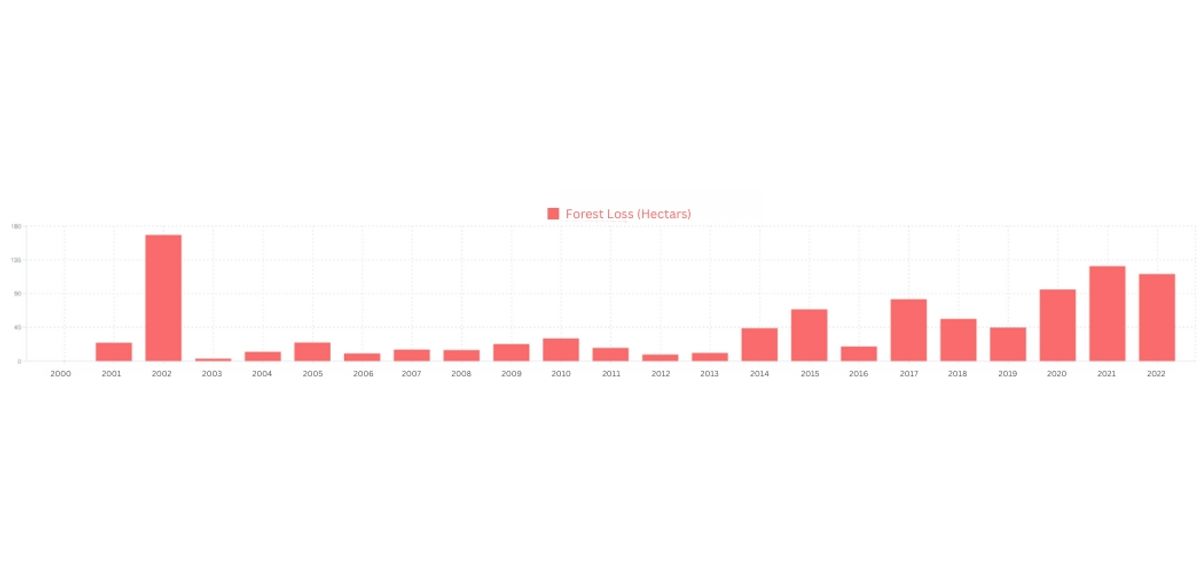
Additionally, the Hansen chart below illustrates instances of deforestation occurring within the area, even as it accounts for the selective logging activities.
Now, let's analyze the leakage area, which we also could retrieve from the PDD and run our analysis on it, as you can see below:
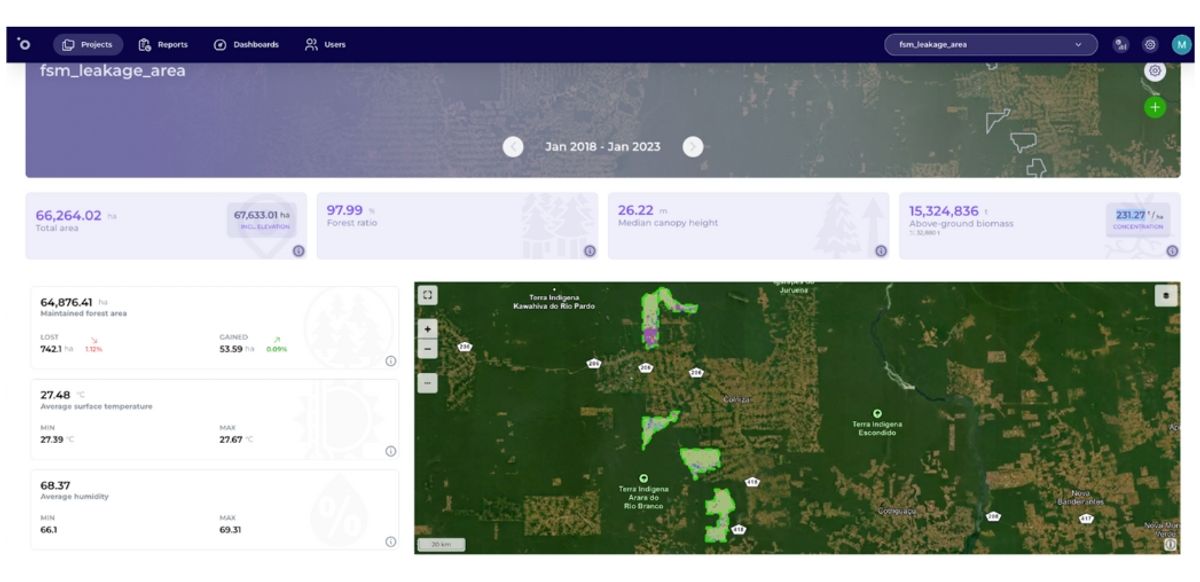
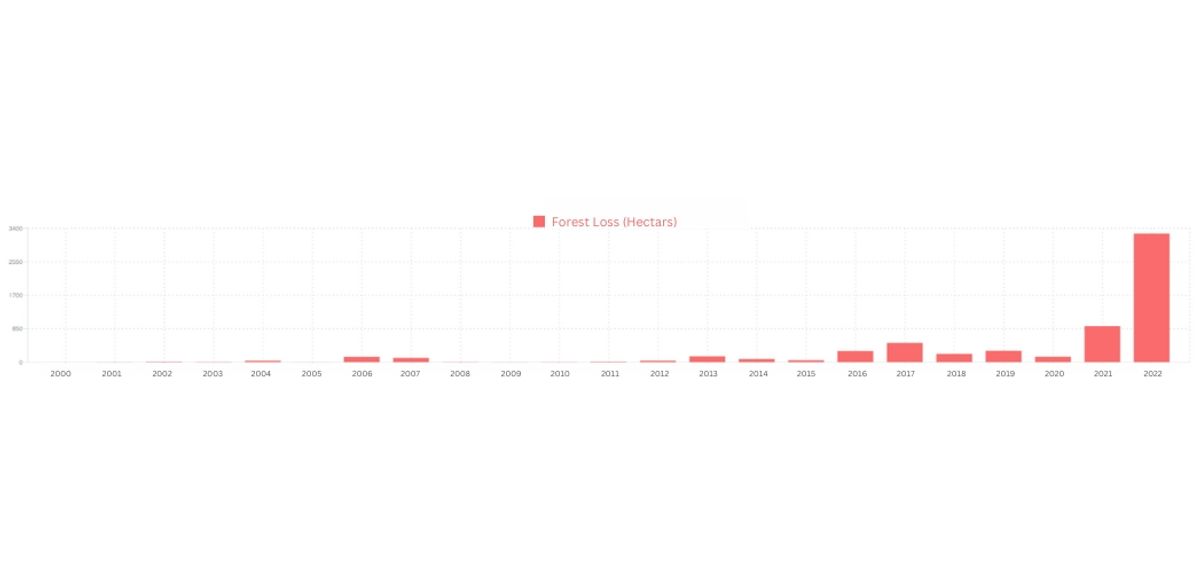
It is interesting to note that there is some deforestation occurring in the leakage area. When we checked the Monitoring Report for 2021, it only reported deforestation in 2018 and 2019. This could be because PRODES lacks the accuracy to detect small patches of deforestation, while our approach can detect areas as small as 100 m². Additionally, it's worth noting that in 2022, a significant increase in deforestation is evident on the chart. This suggests that in the next monitoring report, there will likely be new deductions from their credits due to leakage.
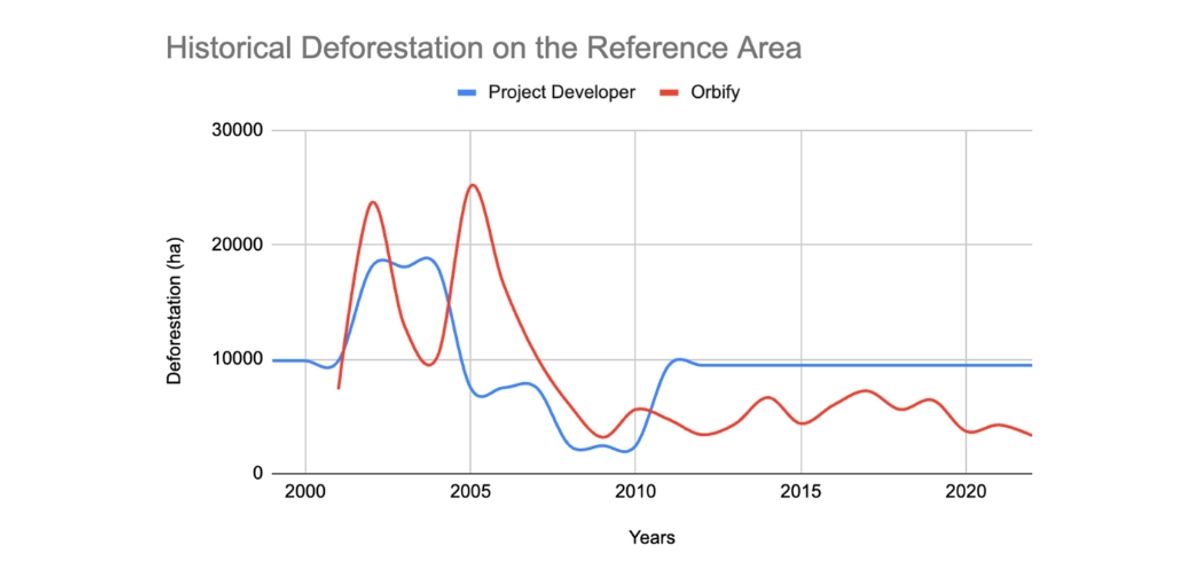
In methodology VM007, it is necessary to establish a Reference Area to calculate the deforestation rate. We can extract this reference area from the Project Design Document (PDD) and demonstrate it in the chart below, comparing the deforestation that occurred in the ten years prior to the project's start date with what was claimed to be deforested and used for their baseline.
We analyzed the data for the ten years preceding the project start date and compared it with the data provided by the Project Developers. However, a problem arose as we only had data for the years 2001 to 2009, and not for the full period from 1999 to 2009.
An interesting point to note is that the methodology suggests that if a clear trend is observed, we should consider that trend when predicting deforestation. If no clear trend is observed, we can use the average ratio of deforestation in the reference area to predict potential deforestation in our project area and then receive credits. In this project, they considered the average. However, it's evident that deforestation has shown a clear declining trend, and even today, deforestation in the reference area is significantly lower.
When analyzing the project developer's baseline, it's evident that they considered the average, as mentioned earlier, which is approximately 9463.075 ha/year of deforestation, corresponding to a deforestation rate of 2.94% per year. However, the reality is quite different. It's clear that deforestation has been following a declining trend and has remained around 5000 ha/year, corresponding to a deforestation rate of 1.55% per year. This difference would have a substantial impact on the final number of credits.
In conclusion, we observed some degradation in the Project area due to selective logging, as well as patches of deforestation in the Leakage area after the implementation of the project activities. Furthermore, we demonstrated some fundamental concepts of the VM0007 methodology from VERRA for REDD projects and emphasized the importance of using accurate data for reporting emissions avoidance.
In this review, we illustrated how the geospatial data platform can provide quick and easy access to a NbS project and its historical activities in the area. This information is valuable for developers, investors, and government decision-making.
The objective of this review is to showcase the power of our geospatial data platform in presenting data objectively. We refrain from drawing any conclusions on the project's success but rather focus on demonstrating how Earth Observation (EO) data can be invaluable in all stages of planning, monitoring, and verifying REDD projects.