Last edited: May 16, 2024
Published: April 16, 2024

Orbify
Earth Intelligence Specialists
Blog Post
Last edited: May 16, 2024
Published: April 16, 2024
Orbify
Earth Intelligence Specialists
In Orbify's review, we select a Natural Based Solution (NbS) project related to the Voluntary Carbon Market, sourced from reputable registries. Afterwards, we are using our Geospatial Data Platform (GDP) to demonstrate how our platform can be utilised to analyse a VCM project.
Our approach demonstrates how stakeholders can leverage our geospatial data platform to assess the feasibility and validity of projects. By harnessing geospatial technology and analytics we are ensuring accurate data for carbon project developers. Through our platform, users can make informed decisions for cost-effective, timely, and impactful climate change mitigation strategies.
For this review, we've chosen to analyze the Agrocortex REDD Project, located in the states of Acre and Amazonas, Brazil, and registered on the Verra Registry. This project was selected for its notable reputation as one of the better-known initiatives in Latin America, yet it has also faced significant criticism. In our in-depth review, we will go beyond merely examining geospatial data. We aim to verify whether all instances of deforestation have been accurately reported in the monitoring reports and assess the validity of the final carbon credits issued, using satellite data to support our analysis.
The project is located in the border between the States of Acre and Amazonas, within the agricultural expansion frontier region, around 25km south of the BR-364, the main highway that crosses the State of Acre. The main deforestation and degradation agents acting within the reference region during the historical period were: cattle ranching, mainly producing beef cattle; and timber harvesters, acting both legally and illegally. Deforestation in the region involves spatially overlapping activities: firstly, extraction of commercially valuable tree species for sale to timber companies. The final step is the slash-and-burn deforestation of the area above for pasturelands and cattle ranching.
The main objective of the present REDD project is the conservation of 186,219.06 ha of Amazon rainforest area within a private land named “Fazenda Seringal Novo Macapá”.This will be achieved through avoidance of unplanned deforestation, following the REDD AUD framework.
The project proponent is Agrocortex Madeiras do Acre Agroflorestal Ltda., a Brazilian private company responsible for the operations of Agrocortex Florestas do Brasil S.A – the holding. The latter also holds Agrocortex Florestas Tropicais Ltda., which owns another private company named Batisflor Florestal Ltda. – the landowner of Fazenda Seringal Novo Macapá.
In March 2014, the Agrocortex holding company and Batisflor Florestal Ltda. established anagreement to harvest forest products/by-products and non-timber forest products (NTFPs) in the Project Area, in a manner that is consistent with local ecosystem conservation, granting rights of 1) timber harvesting, 2) NTFPs extraction and 3) carbon credits to Agrocortex Madeiras do Acre Agroflorestal Ltda. Agrocortex is a sustainable development company engaged in conserving the environment through sustainable forest and NTFP management, generating greenhouse gases (GHG) emission reductions, and NTFPs. Agrocortex started the sustainable forest management operations in June/2014, which defines the project start date because the activity resulted in reduced GHG emissions. The present REDD project is estimated to avoid a predicted 30,006 ha of deforestation, equating to 14,507,808 tCO2e in emissions reductions over the 30 year project lifetime (01-July-2014 to 30-June-2044).
In our review, we will focus solely on the Project Area as detailed on the VERRA website. Since this project is classified as an APD (Area of Permanent Direct use), it does not have a Reference Area but utilizes proxy areas instead. Unfortunately, these proxy areas have not been provided, and the available maps are of insufficient quality for extraction. Similarly, information about the project's leakage area is unavailable, and the provided maps are of even poorer quality, making it impossible for us to apply our analytical tool to these areas.
Our objective with this review is not to rate the project or advise potential investors on whether to invest in it. Instead, we aim to demonstrate how our platform can be utilized to analyze projects of interest. If you are seeking project investment consultancy, please feel free to contact us.
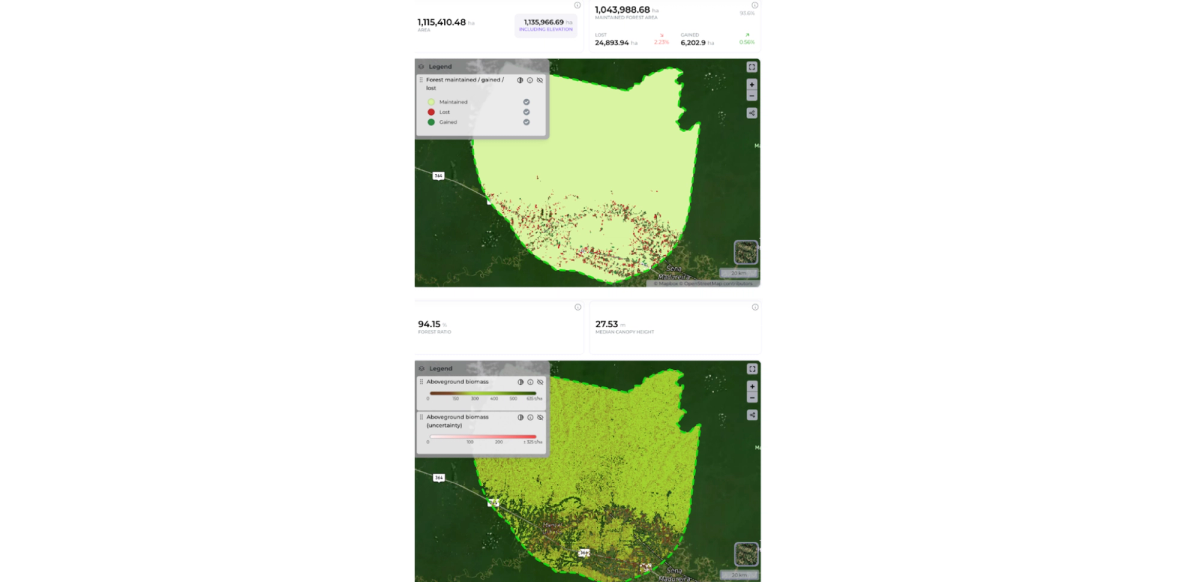
We uploaded the project area onto our Orbify platform and selected specific dates for the analysis to gain insights from the dashboard and map indicators. For this particular review, we chose the period from January 1, 2020, to January 1, 2024. Let's explore the change analysis derived from our platform:
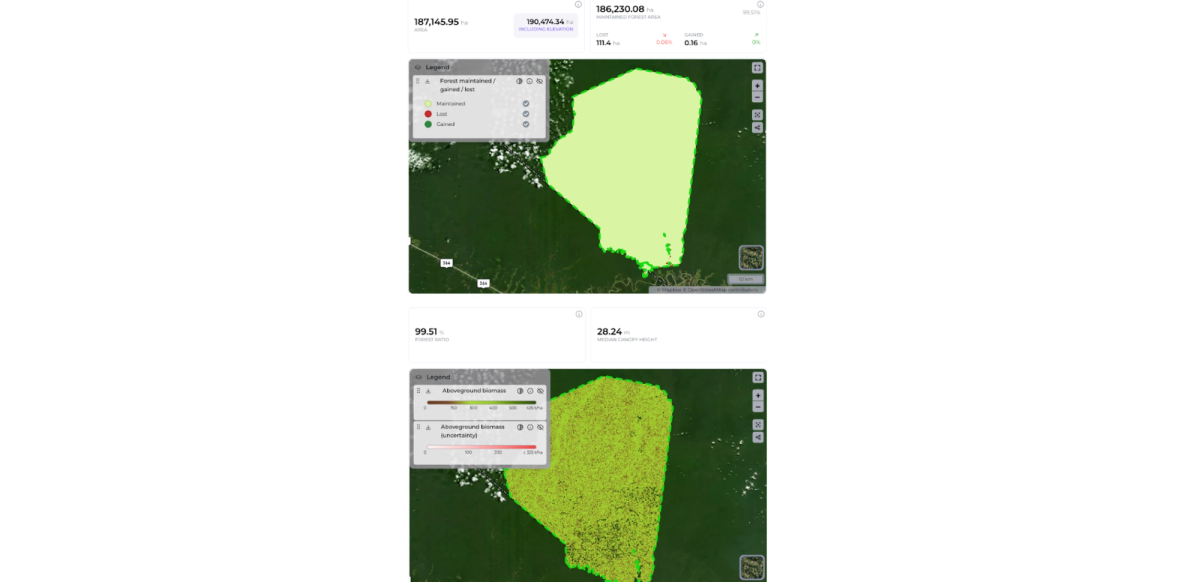
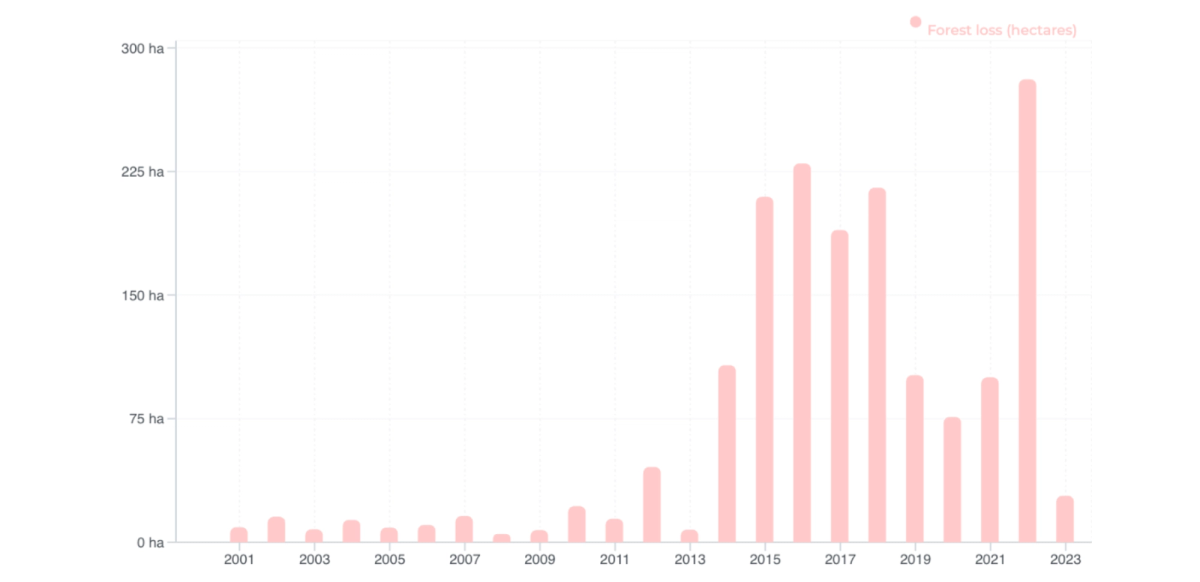
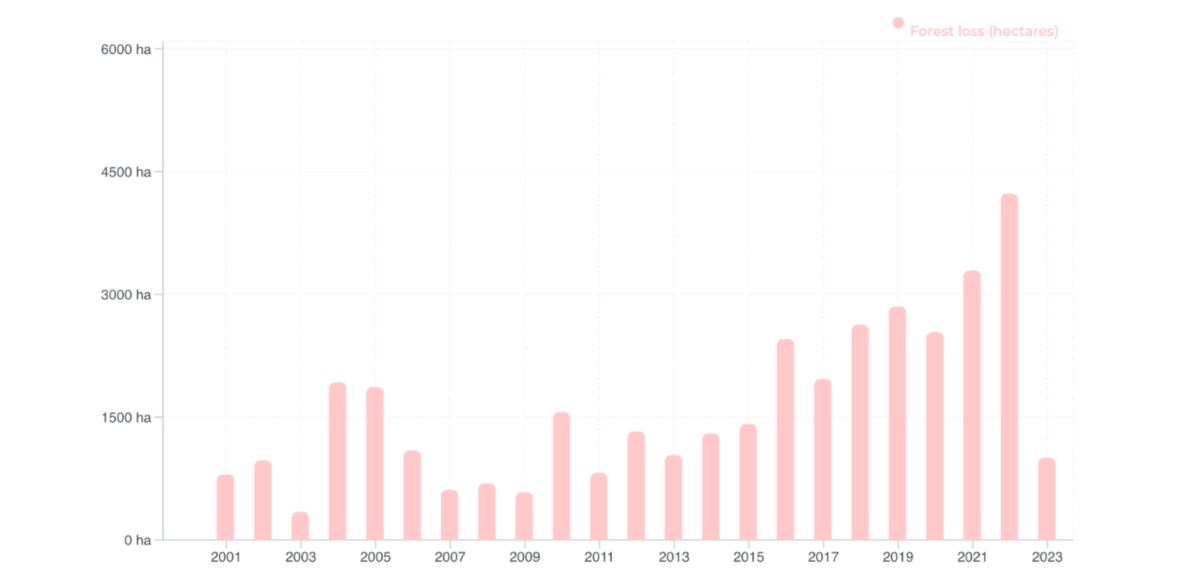
Upon analysing the data, we observed the extent of maintained forest versus deforestation and degradation within the area. Notably, there is a significant threat of deforestation at the bottom of the project area, near the river and roads. Despite these challenges, the project has been quite successful in halting the advance of deforestation. The forest loss depicted in the chart is primarily associated with sustainable forest management activities. The Hansen chart below illustrates some deforestation occurring within the area, but it is at a relatively low intensity.
When compared with the deforestation reported by the Project Developer we can see that there's a consistency presented with the data observed by Orbify's platform.
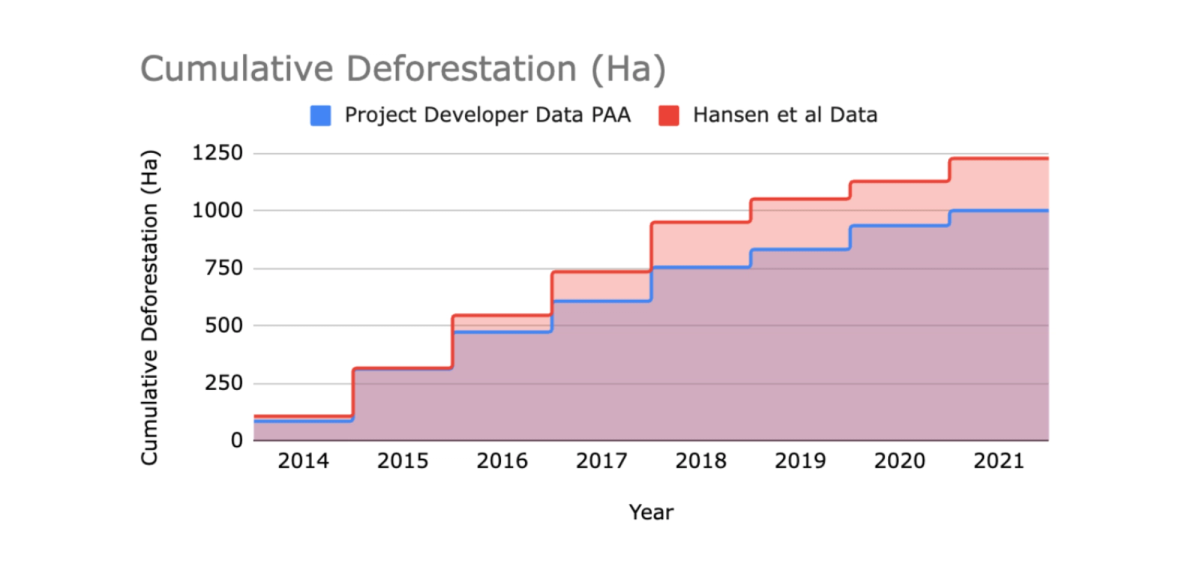
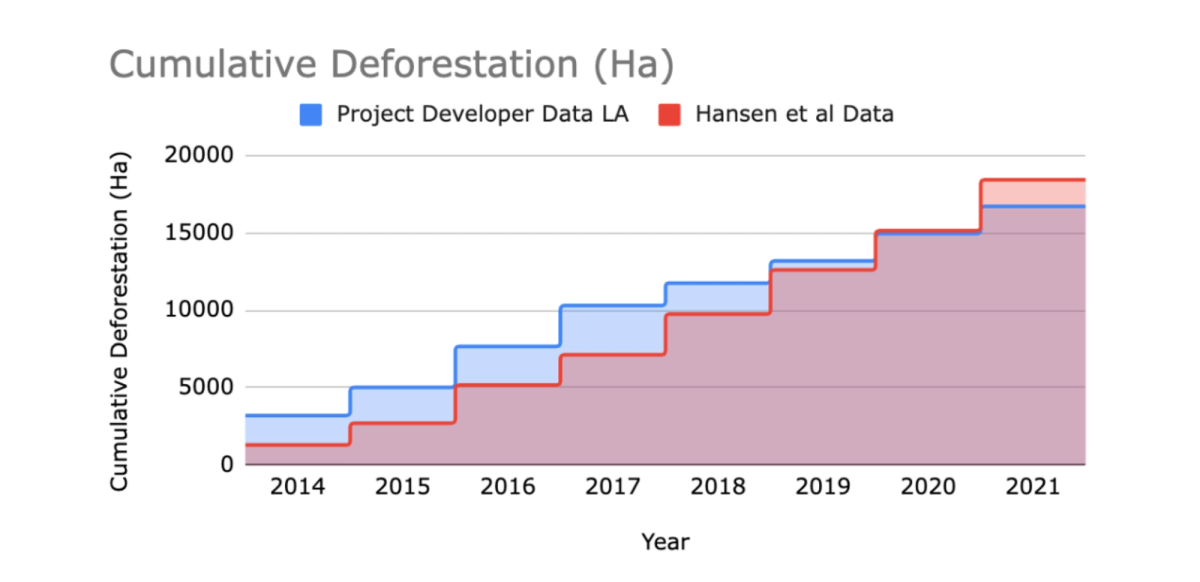
When compared to the PDD data we can see what was reported on the project area as deforestation and what was observed based on Global Forest Watch, Hansen et al data. The difference is around 250 hectares, which is not extremely significant when compared proportionally to the project size area. See the chart below.
We uploaded the leakage area data onto our Geospatial Data Platform and selected the same analysis period as used for the project area to ensure consistency. This enabled us to view and utilize the dashboard and map indicators effectively.
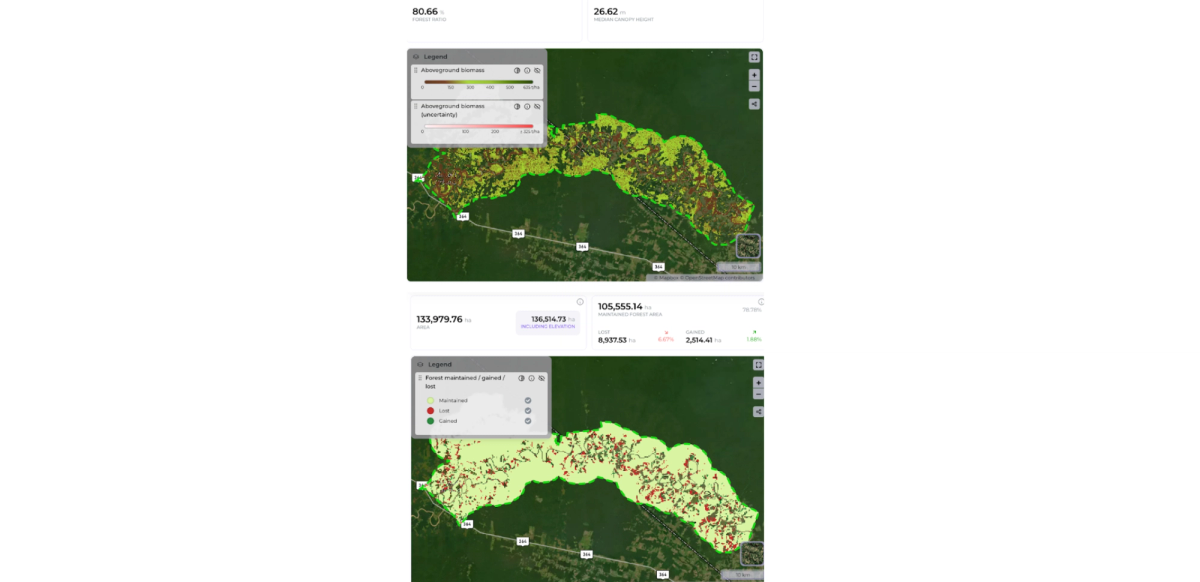
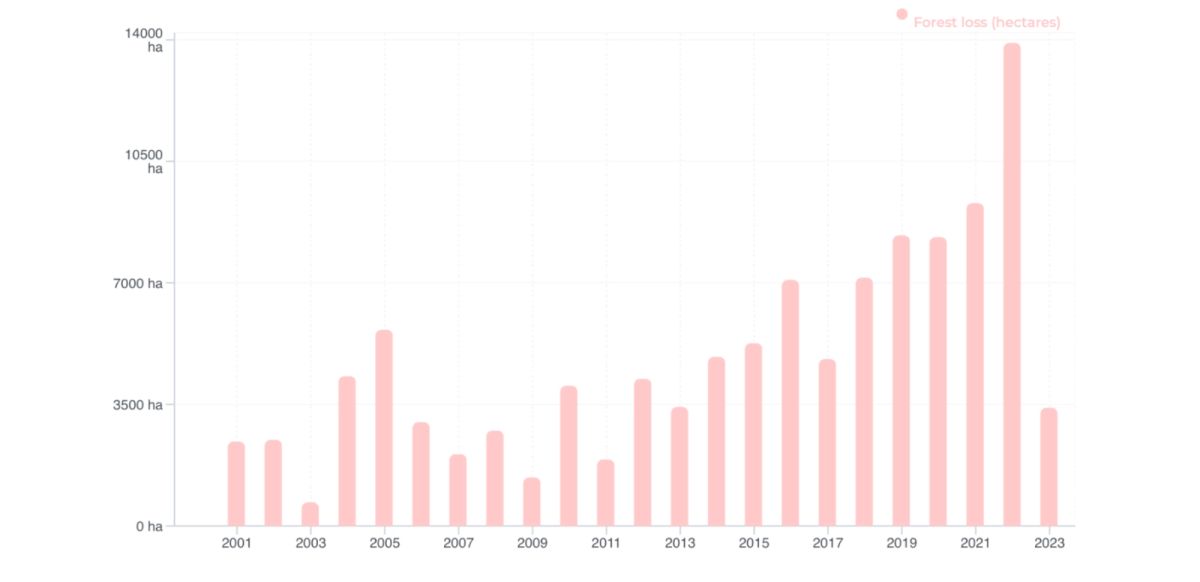
When analyzing the deforestation within the Leakage Area, we examined changes that have occurred since the baseline period, established in the year 2000.
Upon reviewing the chart, it appears that the implementation of the project in 2014 may have led to an increase in deforestation values, potentially indicating a leakage event. It is crucial now to verify whether this was accurately reported by the project developers. This information can be further examined in the chart provided below.
The chart of comparison of the cumulative deforestation on the leakage area using project developer data and our platform shows that the project developer reported the deforestation in a similar trend and sometimes even similar values than what was observed by the satellite imagery, which is a good point for the project, being as well most of the time more sensitive to the deforestation than our dataset.
In this step, we uploaded the reference area onto Orbify’s Geospatial Data Platform and selected the same analysis dates as those used for the project area. This approach ensures consistency and allows us to effectively utilize the platform's dashboard and map indicators for comprehensive analysis.
We analyzed the claims made by the project developers regarding the baseline period for the reference area, where they stated that "The annual average deforestation rate during this period was 0.25%" for the years 1999 to 2013. Unfortunately, the Hansen et al. dataset, which we utilized for verification, only begins in 2001, limiting our historical reference period to 2001-2013. Upon reviewing this adjusted timeframe, our data shows that the average rate of deforestation was approximately 0.26%, which closely aligns with the developers' claims, lending credibility to their report.
This project operates under the VM0015 standard and bases its future deforestation predictions on spatial modeling for deforestation forecasting. It is important to note that this aspect of their methodology was not reproducible in our study, which focuses on empirical data analysis.
In conclusion, we can see that some deforestation in a some relevant amount on the project and leakage area, but when looking to the proportion of the size of the areas we can see as well that it was not huge %, which lead us to say that the project owners are being successful at stopping the high deforestation rates. Besides that, the project was transparent and their results from the monitoring report was aligned with our results from our platform, which reiterate the fact that our platform is aligned with the high level standards and reporting structure.
On this review, we showed how we can use the geospatial data platform to quickly and easily access a NbS project, giving insightful information and helping on the decision making of developers, investors and government.
The objective of this review is to showcase the power of our geospatial data platform in presenting data objectively. We refrain from drawing any conclusions on the project's success but rather focus on demonstrating how Earth Observation (EO) data can be invaluable in all stages of planning, monitoring, and verifying REDD projects.