In this article, we will review the impact of Earth Observation and Environment monitoring tools to reduce the severity and effects of urban heat islands. Showcasing the EO tech innovations that save lives by supporting immediate interventions (example: heat shelters) or resilient long-term solutions (examples: urban greening, sustainable urban design).
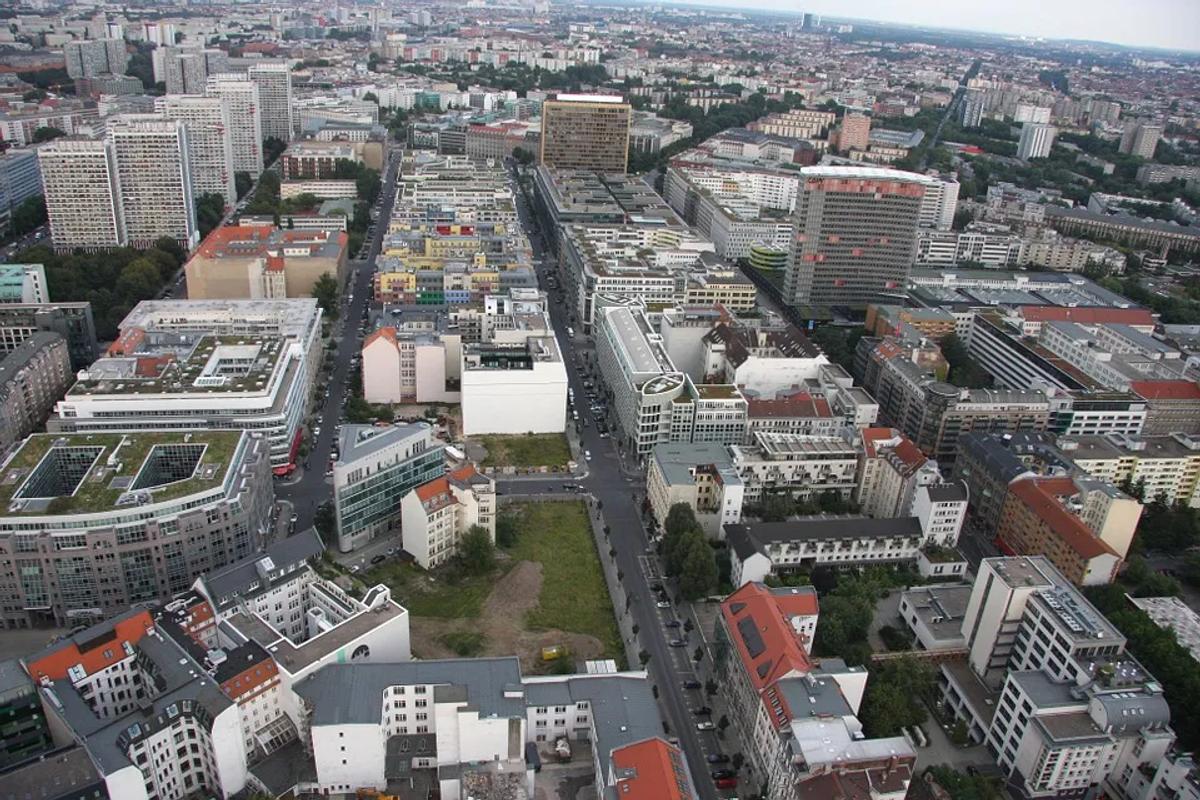
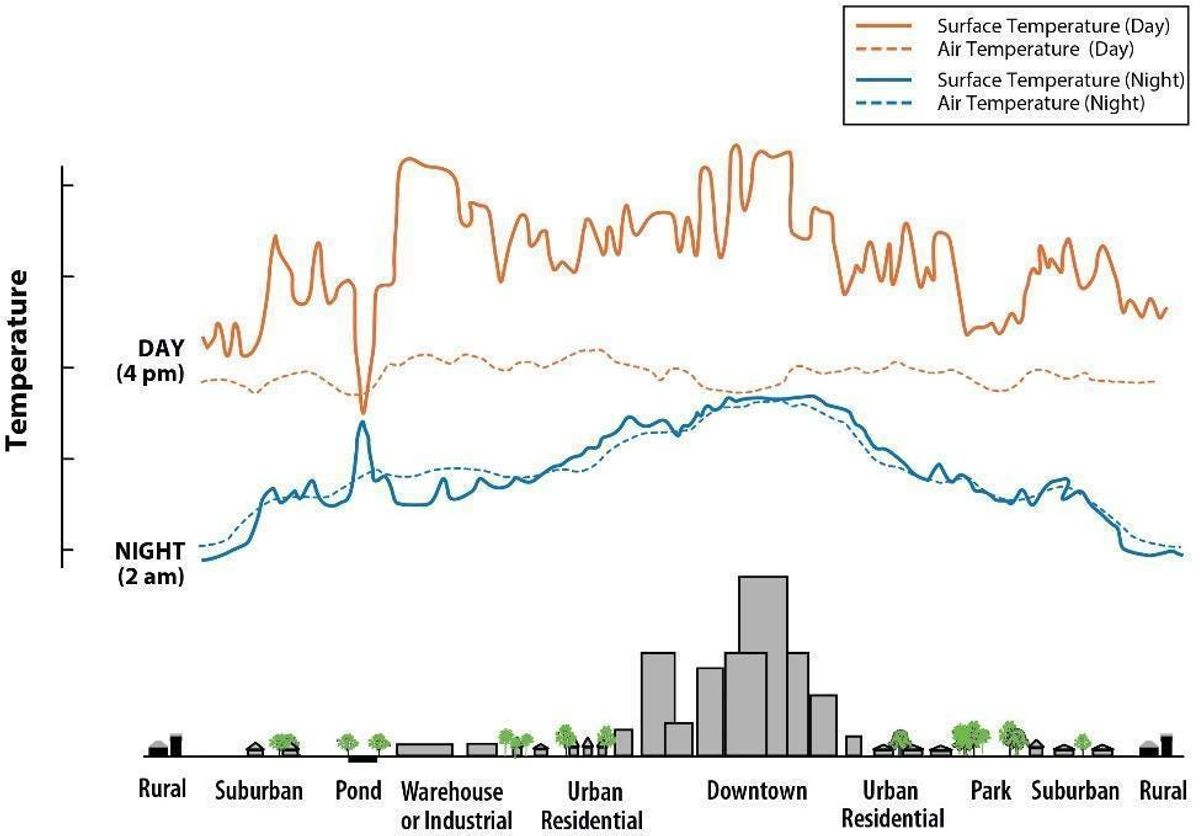
In a city during a heatwave: Leaving a building means walking into a wall of unmoving, stifling hot air. The ground and walls radiate heat well into the night, and the whole city seems to be holding its breath — waiting for a cool breeze. Most people have experienced urban heat in their lives. How we experience heat waves and the severity of health risks depends on many factors. One crucial factor is the heat resilience and greenness of our neighborhoods. The combination of large surfaces storing heat, buildings blocking cooling breezes, and lack of shade through trees leads to urban heat islands. These areas can be hotter than surrounding areas by 1 to 4 °C (about 2 to 8 °F). These temperature differences occur not only in the day but also at night. Because of the lack of freely accessible places to cool down, like malls and libraries, hot temperatures persisting into the night can seriously impact residents’ health.
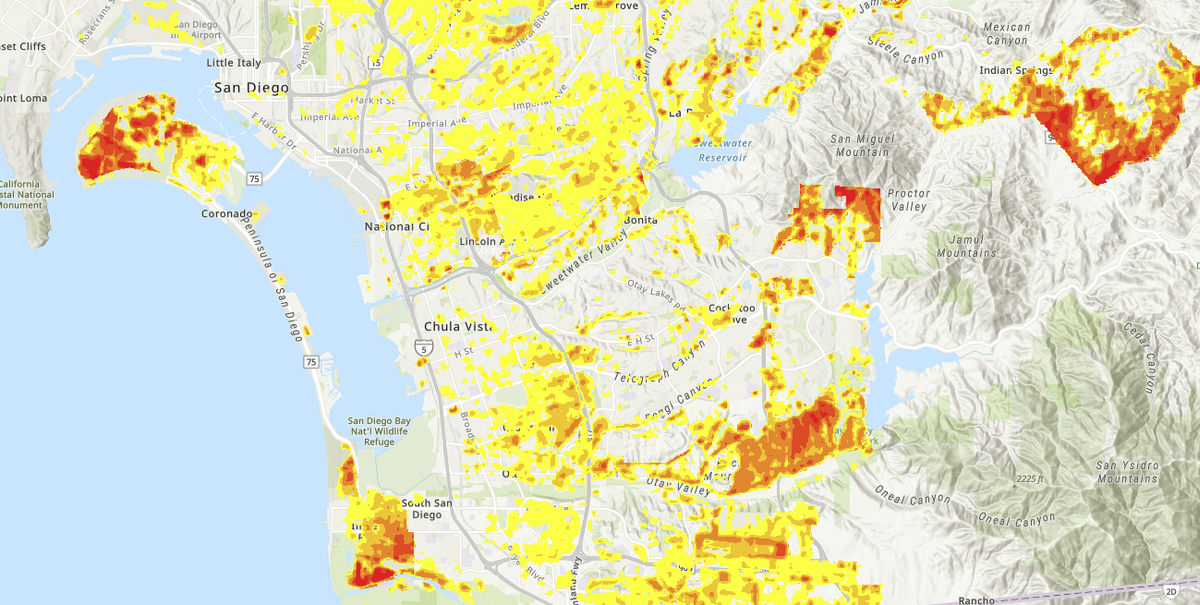
Due to past zoning and urban planning decisions, heat islands are often especially severe in low-income communities. Infrastructure is less heat resilient, and residents cannot afford to install insulation or air conditioning. To help vulnerable residents stay safe during heat waves, it is crucial to identify neighborhoods negatively affected by urban heat islands in the past. With better knowledge about hotspots for heat, officials and NGOs can optimize locations for cooling centers, build partnerships to amplify heat warnings, and raise awareness for adapted coping strategies for urban heat stress. With the complexity and size of urban environments, high-resolution imagery from satellites is the most effective way to gain accurate historical records of cities in their entirety. The long-running surface temperature recordings by NASA’s Landsat satellites offer great potential to assess past urban heat events. Landsat satellites have been orbiting the earth for decades providing high-resolution images with a resolution of 30m, re-recording a location every 16 days. For a neighborhood built in the 1980s, there are now over 800 images, each taken by various optical and thermal sensors. These sensors reveal the surface temperature, measured directly above the ground and on other surfaces, like trees and buildings.
Combining time–series on land surface temperature with digital elevation modeling and information about land cover provides reliable insights into urban heat intensity. While it is crucial to offer cooling options and optimize communications with residents during heatwaves, the long-term goal is to reduce heat islands and build better cities and neighborhoods. The key to alleviate urban heat hotspots — better urban design: Greening areas by planting trees, coating roofs and sidewalks with reflective paint, and using light colors for surfaces of buildings and streets. Cities need to know about the distribution of Urban Heat Island and the vulnerability of their communities to heat. Urban planners need reliable and up-to-date maps showing the presence and extent of urban green and highlighting areas where making surfaces lighter or reflective can bring relief from the heat to develop heat resistant neighborhoods.
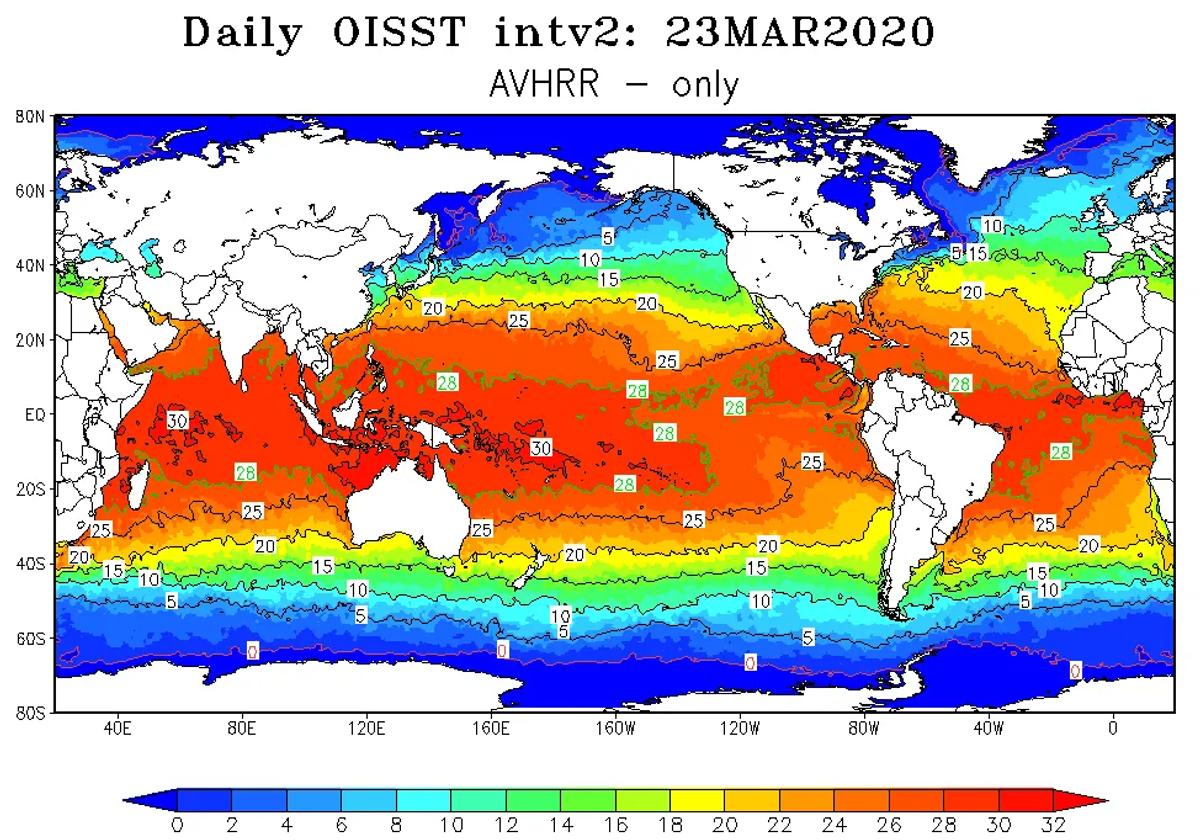
Surface Temperature
Additionally, residents and nonprofit organizations can use the objective, wide-area aspect of remote sensing data to monitor sustainability efforts or advocate for policies towards climate resilience. For example, in Los Angeles, the local initiative “TreePeople” uses research-based solutions to improve and steward green infrastructure, especially in low-income areas. This community-driven nonprofit created the “Los Angeles Tree Cover Map” with high-resolution remote sensing images obtained from a regional consortium (LARIAT). This project is an inspiring example of how aerial maps can help zero in on areas where urban greening can contribute to climate resilience, environmental equity, and public health improvement. The results show the potential for community-driven sustainable urban development and the positive impact of platforms that improve access and affordability of remote sensing images. Another exciting initiative led by the nonprofit “The Trust for People” focused on turning urban schoolyards from heat hotspots to a small oasis in children’s day. Many schoolyards, especially in low-income communities, are in heat islands without much shade or urban green.
By collaborating with Descartes, a geospatial intelligence company, they assessed NASA’s Landsat 8 thermal band data on land surface temperature for 14,000 towns, cities, and census-designated places. Additional data on urban heat and census records helped to pinpoint the schoolyards where greening interventions will bring the most significant benefits to children. These are outstanding developments, highlighting how remote sensing data can lead to change and help stakeholders assess and address inequalities in urban environments. Soon a more widespread use of EO in urban planning will see the uptake of existing technology for monitoring the health and extent of urban greens, especially in hard-to-reach locations like rooftops, spaces between freeways, or on the steep slopes of canyons and cliffs. The benefits of large-scale monitoring of urban green will go beyond heat resilience. They will help to avoid landslides, erosion and make caring for and irrigating urban green more cost-effective and climate-smart.
The growing availability of LIDAR technology, from aerial images to sensors in our mobile phones, provides new potentials for urban 3D analysis. With these tools, assessments of urban green can include the local and regional effects of urban microclimates with amazing fine grain. One of these tools is Orbify - Check it out! As a result, planners can optimize the extent, volume, and structure of green infrastructure in urban landscapes for human well-being and functionality. We can look to other sectors like construction or transportation to see examples to accelerate the uptake of remote sensing technology to create meaningful and accurate insights from existing data and tools. Here, geospatial data is already used more widely and marketed as a cost-effective tool that complements or replaces costly, ground-based survey methods.
Combining remote sensing with automated image identification through Machine Learning or AI will make it feasible to provide pre-processed and ready-to-use high-quality imagery across a large variety of landscapes and environments. To facilitate widespread uptake of earth observation data in urban planning, acquiring and processing large-scale datasets need to become more affordable through tech innovations, better availability, and intelligent applications for open-source imagery and dedicated platforms such as Orbify.