.avif)

Stay ahead of real-time vessel monitoring with Orbify's accurate destination predictions and identify diversions. Transform complex LNG movements into trends with comprehensive filtering and aggregation. Streamline monitoring with customizable alerts and notifications.
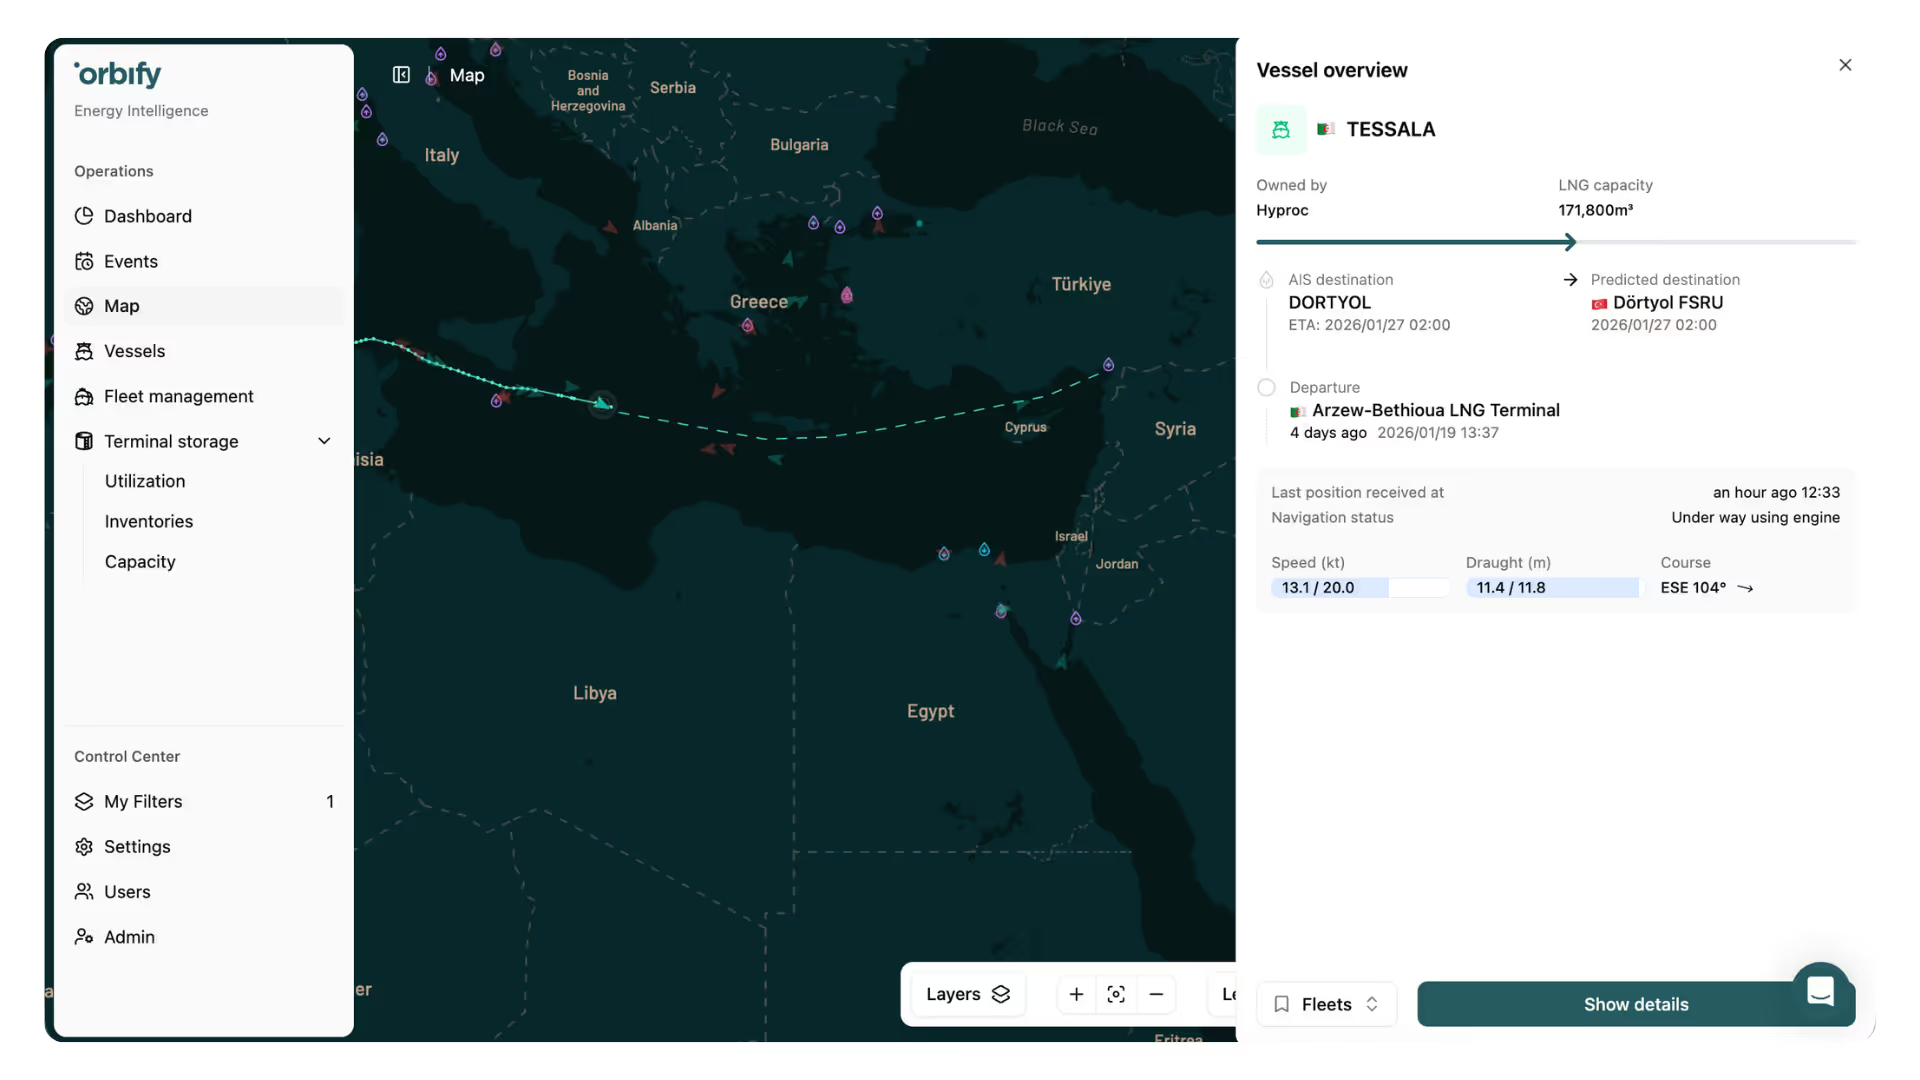
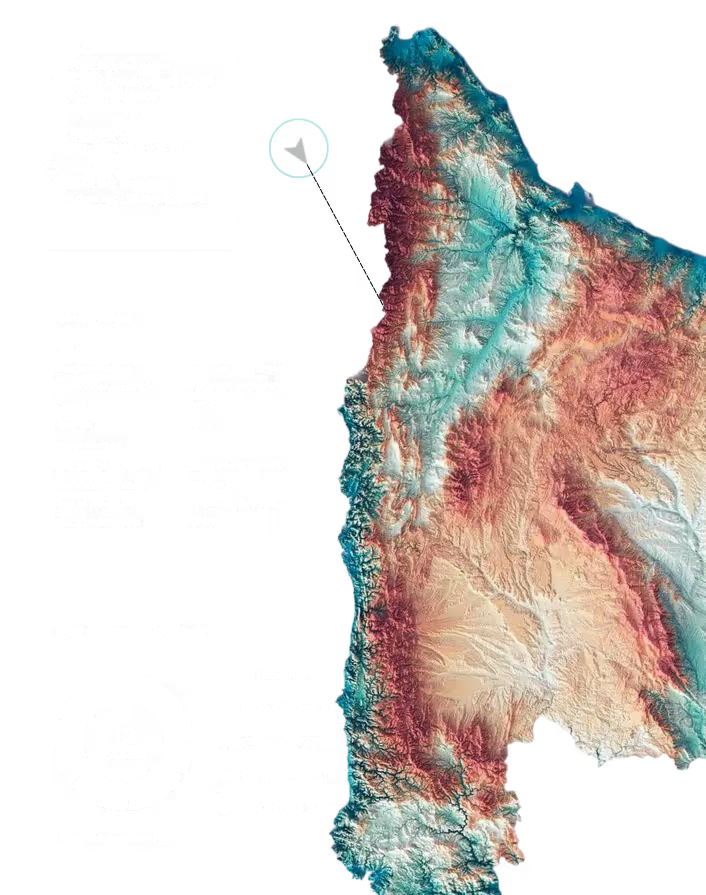
Work with Orbify’s ML-powered engine predicting destinations with transparent and continuously improving confidence intervals.
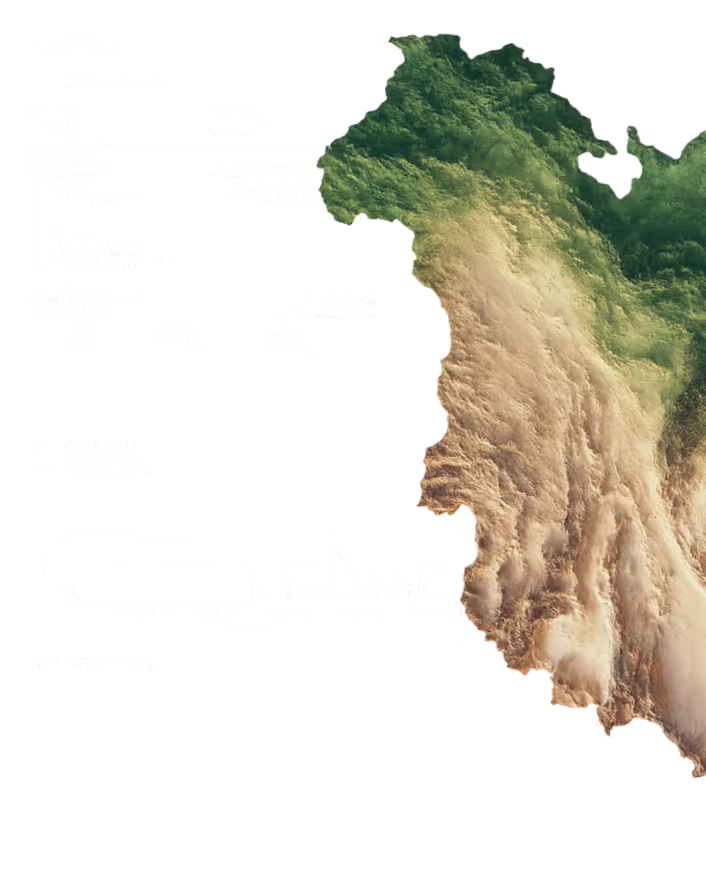
Use Orbify’s automated diversion identification, or set up your own definitions. We combine terrestrial AIS, satellite AIS, port schedules and more sources to minimize false positives.
See some of the last 30 days diversions live →
Run custom-configured automated diversion detection 24/7. Set up automated notifications on events and vessel movements in minutes.
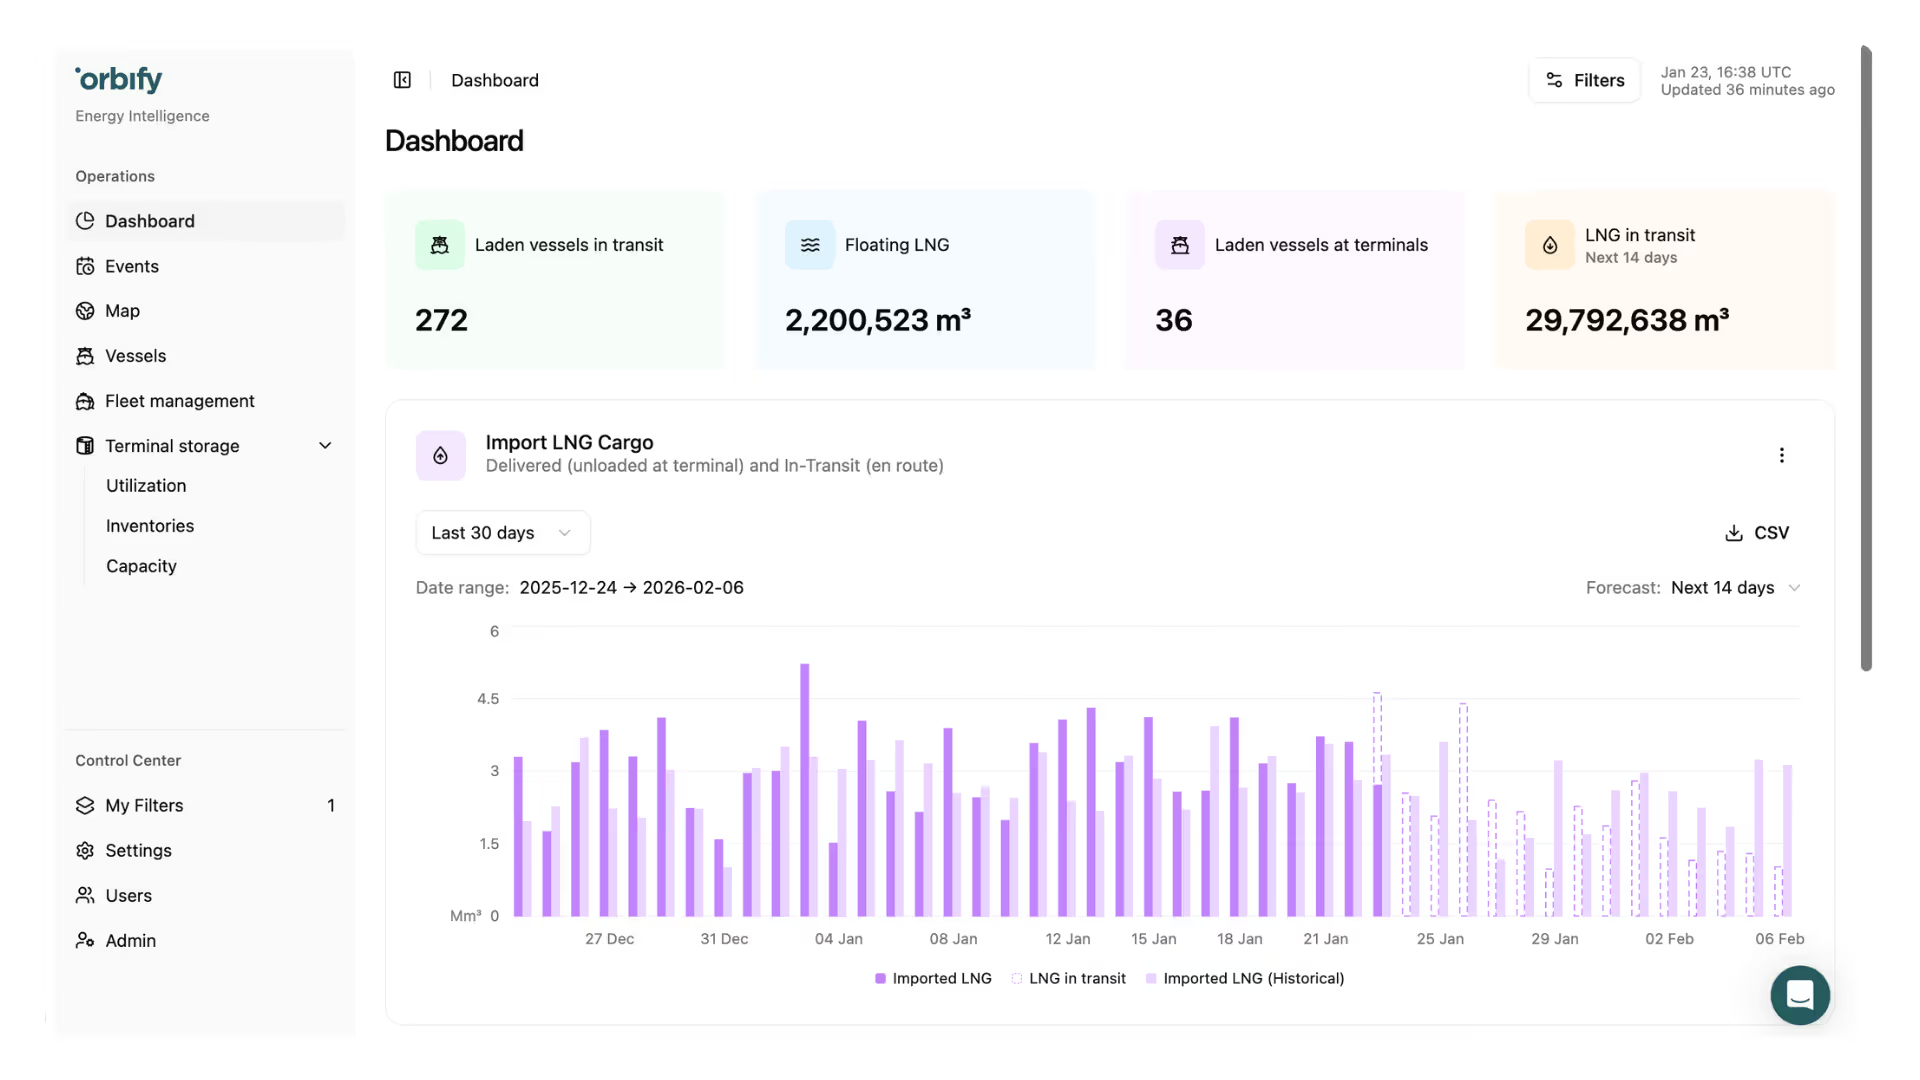
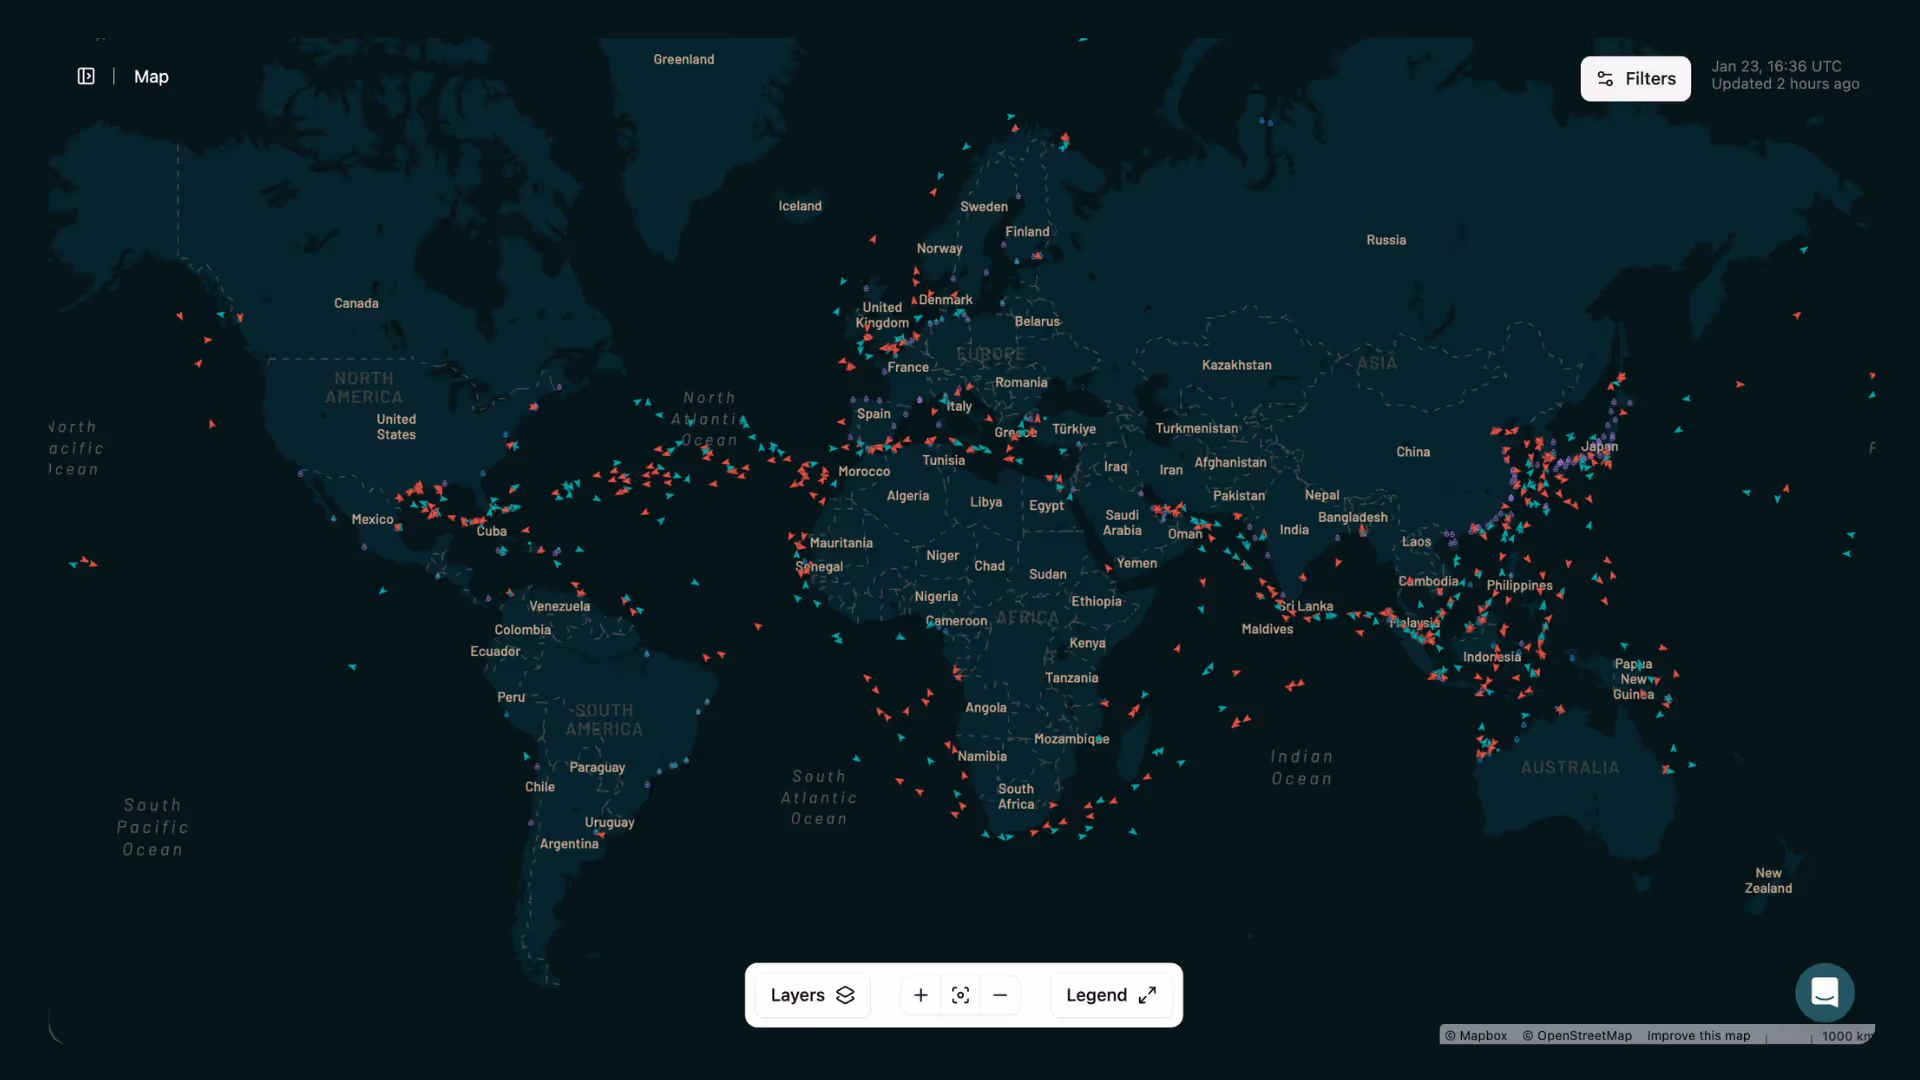
Transform noisy data into clear trends. Aggregate data to reveal shifts in the broader market. Build custom fleets, monitor for floating storage, re-exports and maritime routes.
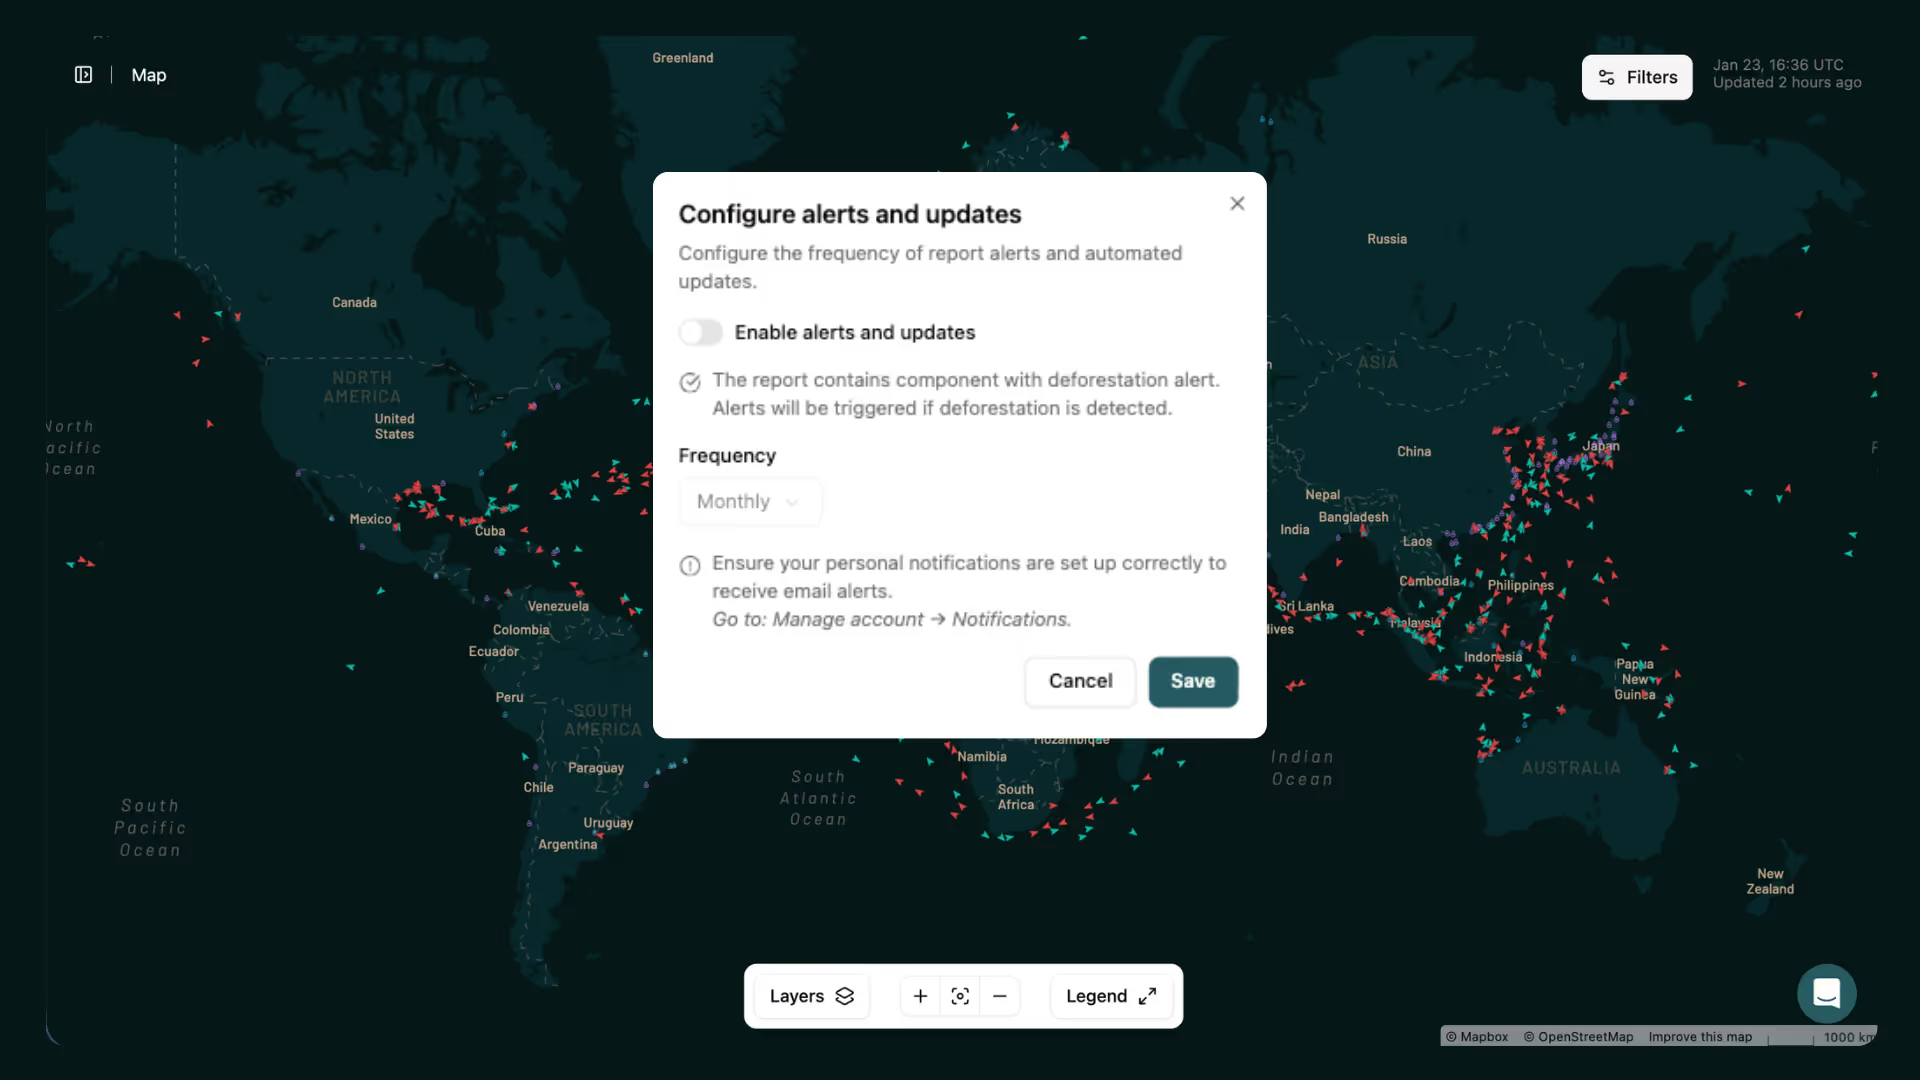
Run custom-configured automated diversion detection 24/7. Set up automated notifications on events and vessel movements in minutes.

Every day, our events feed surfaces vessel anomalies - from AIS destination changes to disruptions to stationary vessels starting to move. Have a look yourself at some of the last 30 days' events.
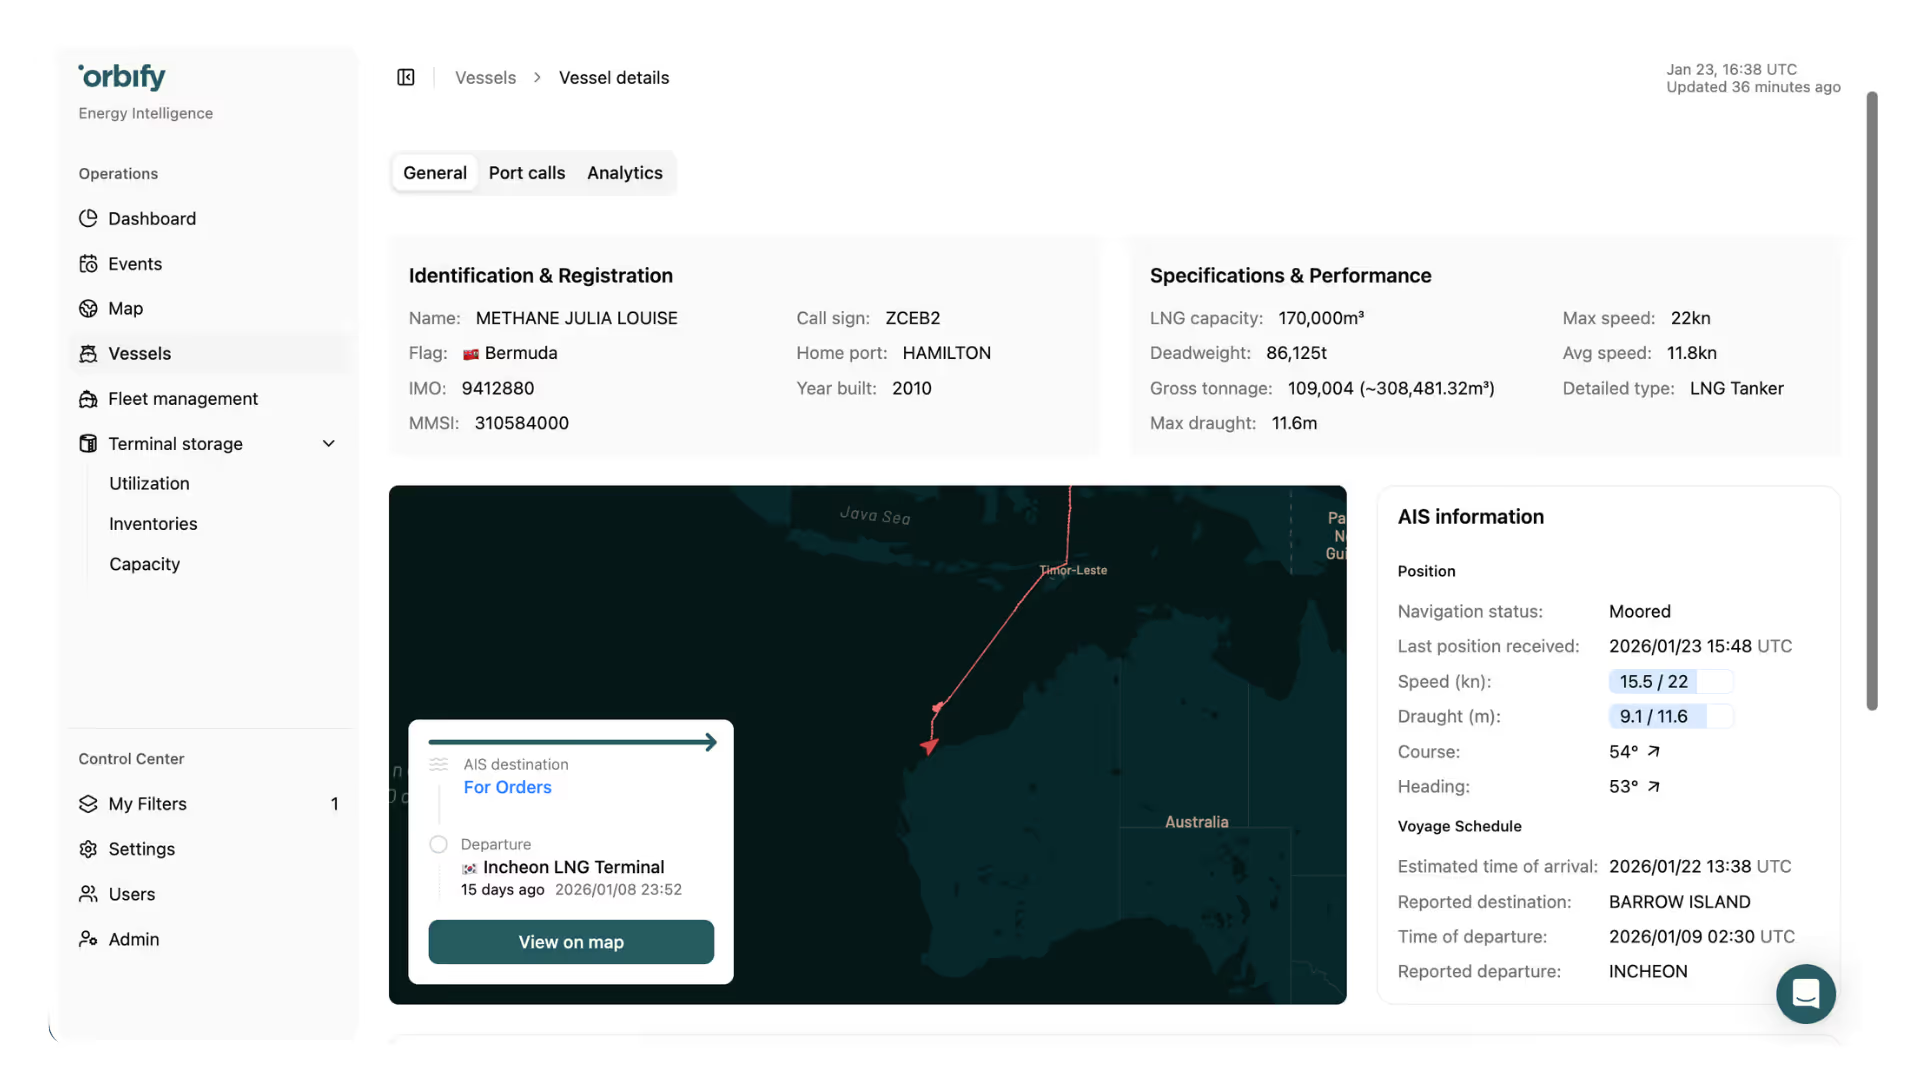
Each event is enriched with voyage context, sourced intelligence, and historical patterns to help you move from signal to insight faster.
Orbify fits your workflow with flexible delivery options. You need API access for systematic trading? Alerts via email, or exports for analysis? No problem with an API-first approach.
Built for energy traders, utilities, and procurement teams who can’t afford to be late to market signals. Orbify delivers accuracy, automation, and actionable intelligence that competitors can’t match.
Orbify brings proven expertise from processing satellite data across 125+ countries and 600M+ hectares. We've built infrastructure handling data for 100,000+ suppliers.
That same intelligence - combining AIS data, satellite imagery, and external information - now powers LNG vessel tracking and predictions.
Machine learning-powered destination forecasting and AI predictions aren't buzzwords at Orbify. They are core capabilities we've refined through years of supply chain monitoring.
We apply the same techniques that analyze global supply chains to predict vessel destinations and detect diversions automatically.
API-first architecture means every data point is available programmatically. Pay only for what you use with modular setup.
Whether you need real-time feeds for systematic trading or simple exports for analysis, the platform adapts to your workflow. Not the other way around.
A small team building a lightweight tool. You're not one of thousands of accounts. Short feedback loops and regular check-ins give our customers direct influence on roadmap.
Pilots launch in 2-4 weeks, not quarters. Feature requests get heard, not lost in bureaucracy.
Whether you trade physical cargoes or financial contracts, Orbify gives you the signals to stay ahead