.avif)

%20(1).avif)
Orbify monitors your network continuously from space. Our platform doesn't just identify threats, it prioritizes them and forecasts what's coming.
Satellite imagery identifies vegetation encroachment, infrastructure changes, and terrain shifts across your entire grid. Updated bi-weekly or weekly.
AI models score risk by zone, combining vegetation height, growth rate, infrastructure proximity, and climate hazards. Know where to send crews first.
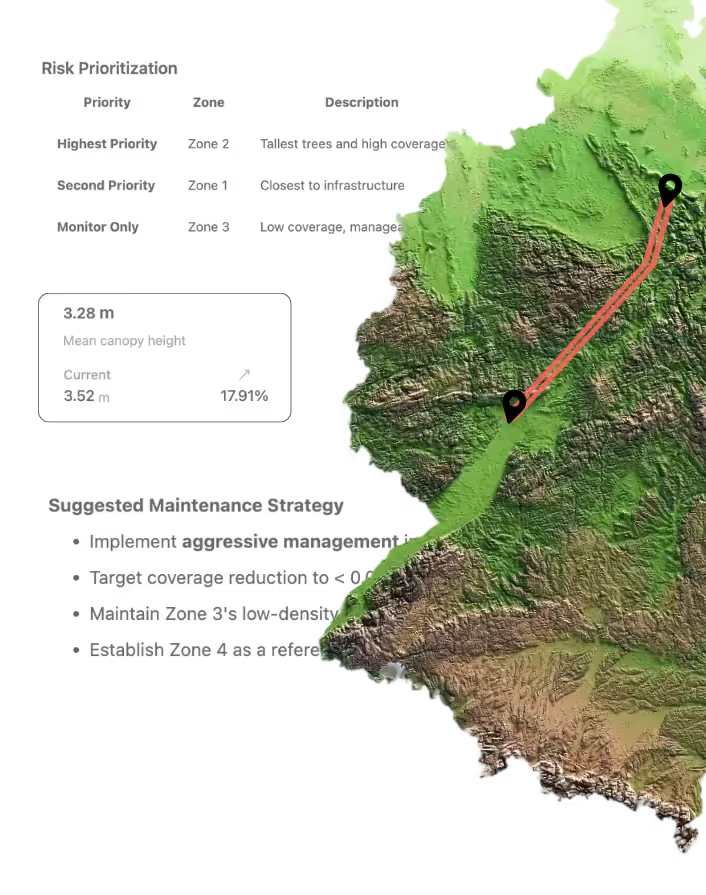
Growth models forecast vegetation states 3-6 months ahead. Plan maintenance windows before threats escalate.
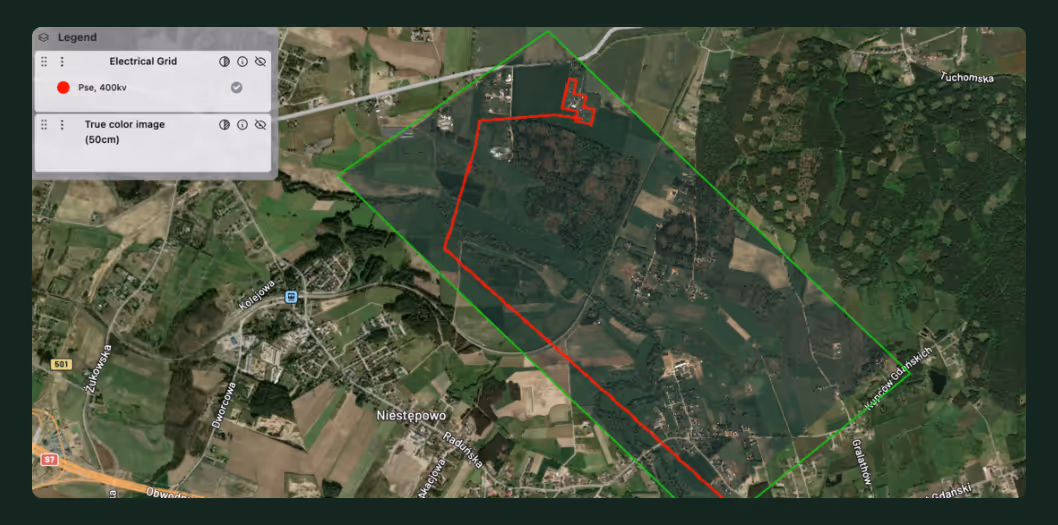
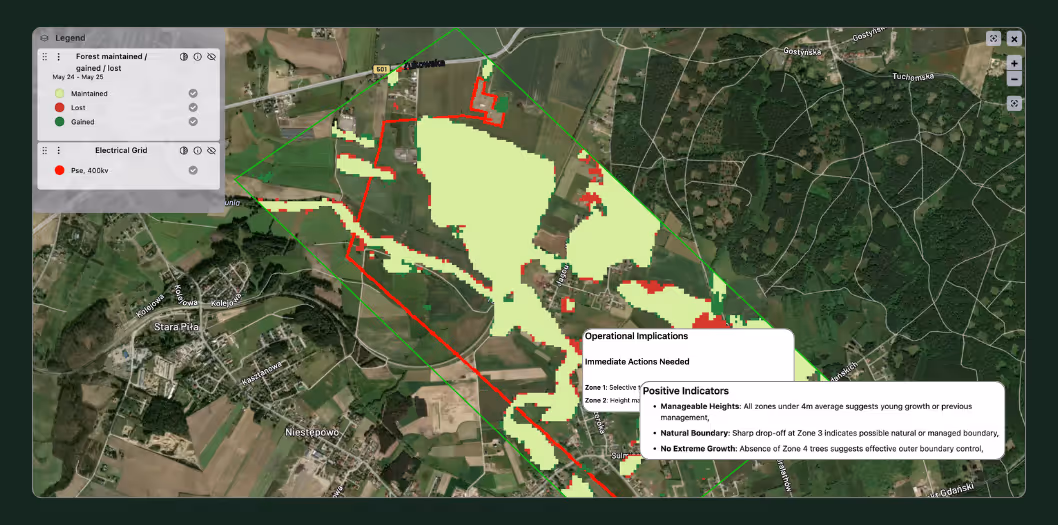
High-resolution imagery (30-50cm) captures your entire network. Multi-spectral analysis assesses vegetation health using NDVI, EVI, and SAVI indices. Cloud-covered regions? We add SAR radar data into the mix for all-weather visibility.
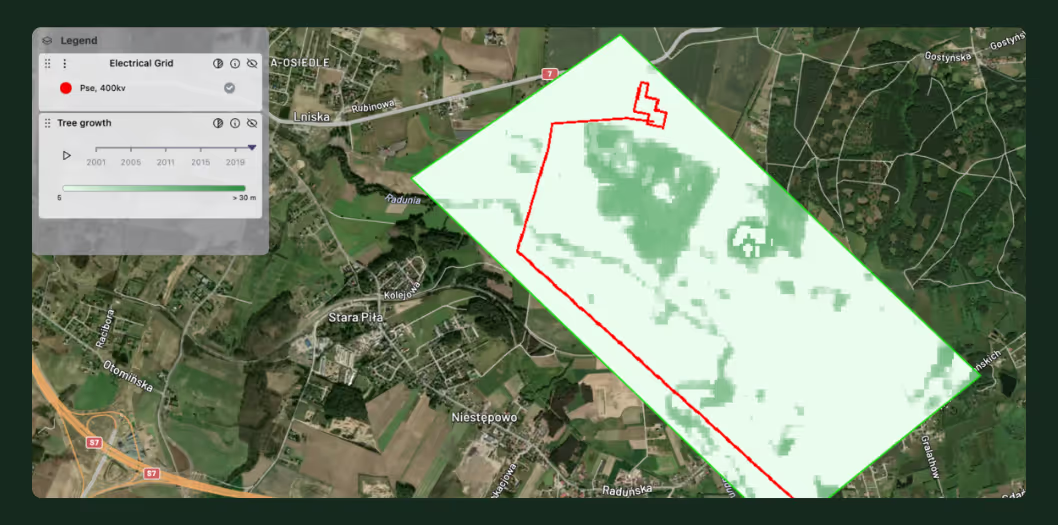
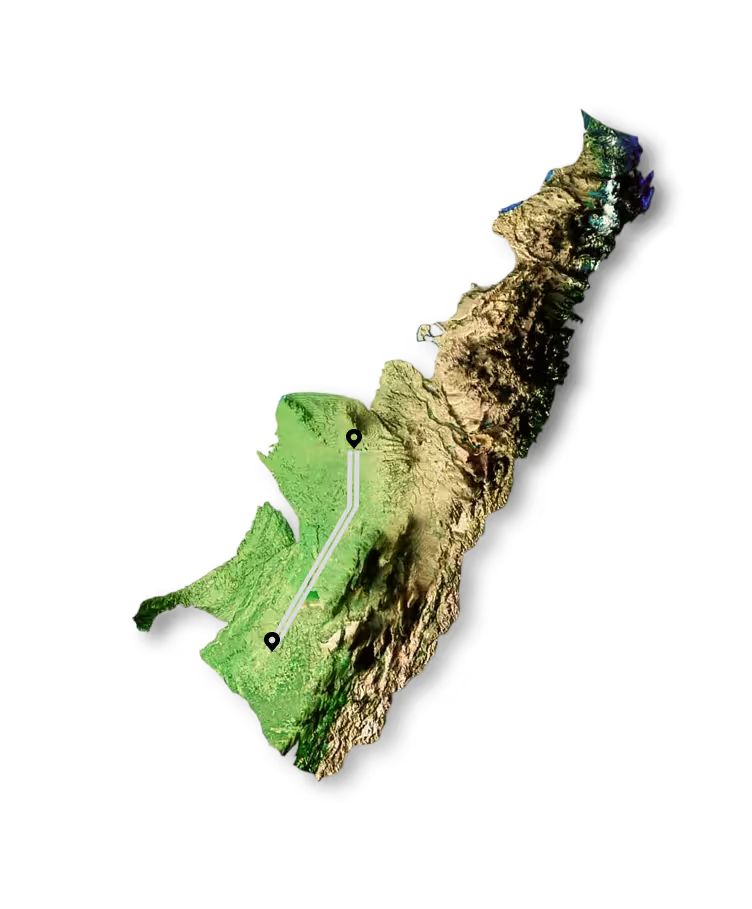
Our AI counts individual trees, measures canopy height, and calculates distance to conductors. Multi-zone risk classification scores threats for different zones defined to your needs.
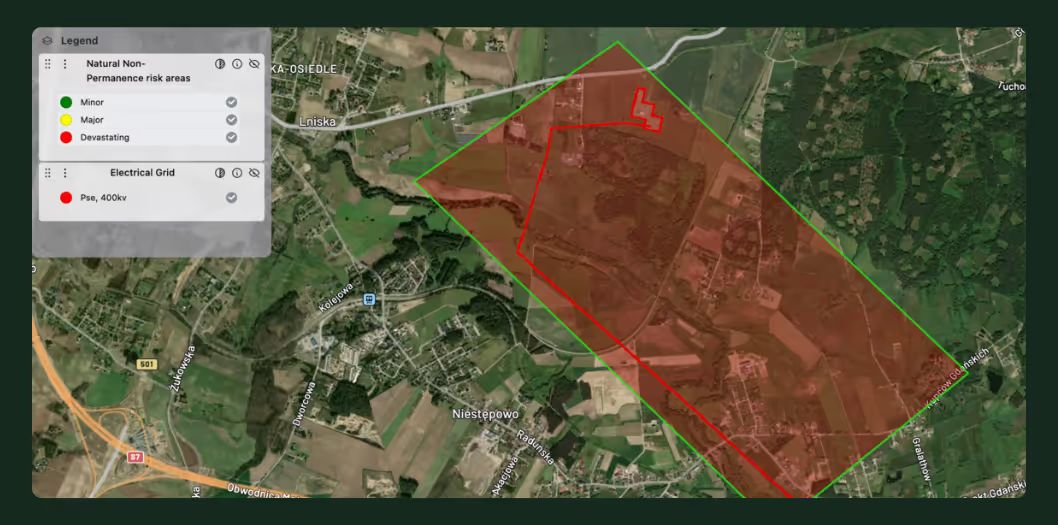
We map wildfire danger, flood exposure, and drought conditions across your corridors. Understand which segments face compounding risks.
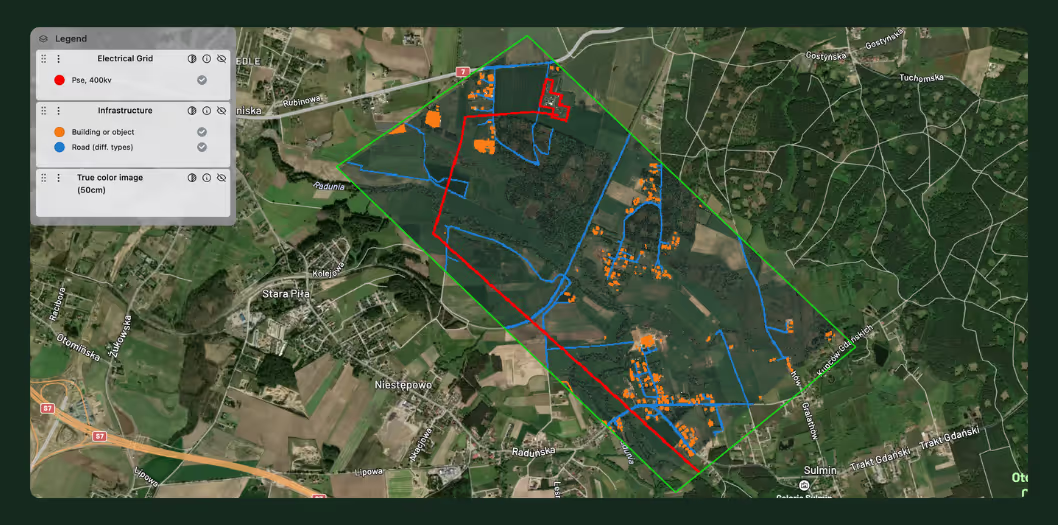
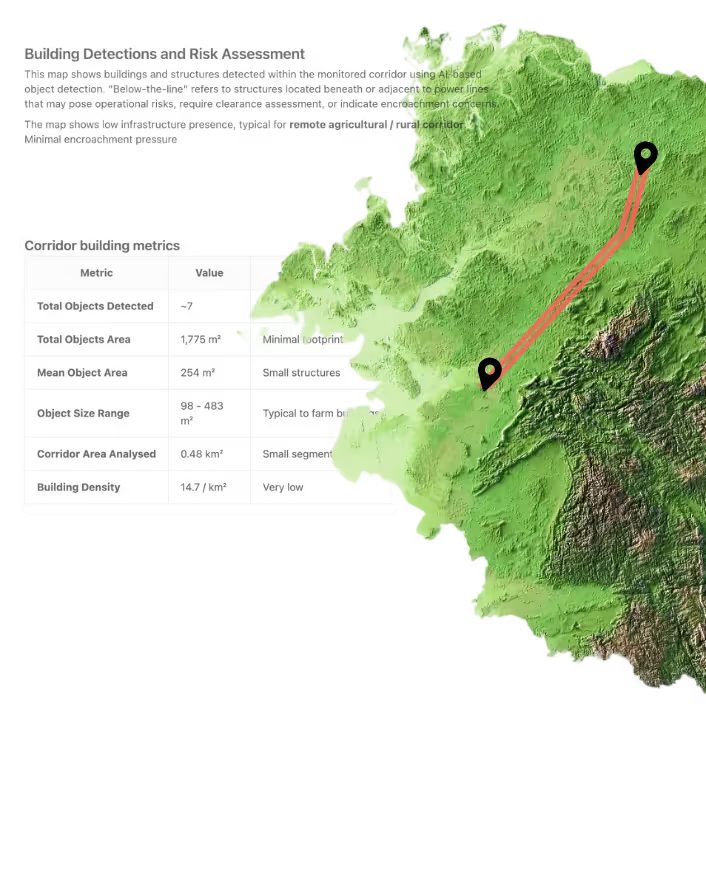
Automated detection identifies buildings, structures, and terrain changes near power lines. Track encroachment before it becomes critical.
Quarterly canopy height updates feed growth forecasts. Know which sections need attention next season, not next week.
Replace costly helicopter surveys and field inspections with automated satellite monitoring.
Utilities typically reduce vegetation inspection costs by 40-60% while increasing coverage frequency.
Identify high-risk trees and infrastructure threats before they cause service interruptions.
Prioritize maintenance where it matters most — protecting customers and network reliability.
Stop sending crews to low-risk areas. Our risk scoring helps you route efficiently, schedule work during optimal windows, and justify budget allocation with evidence-based prioritization.
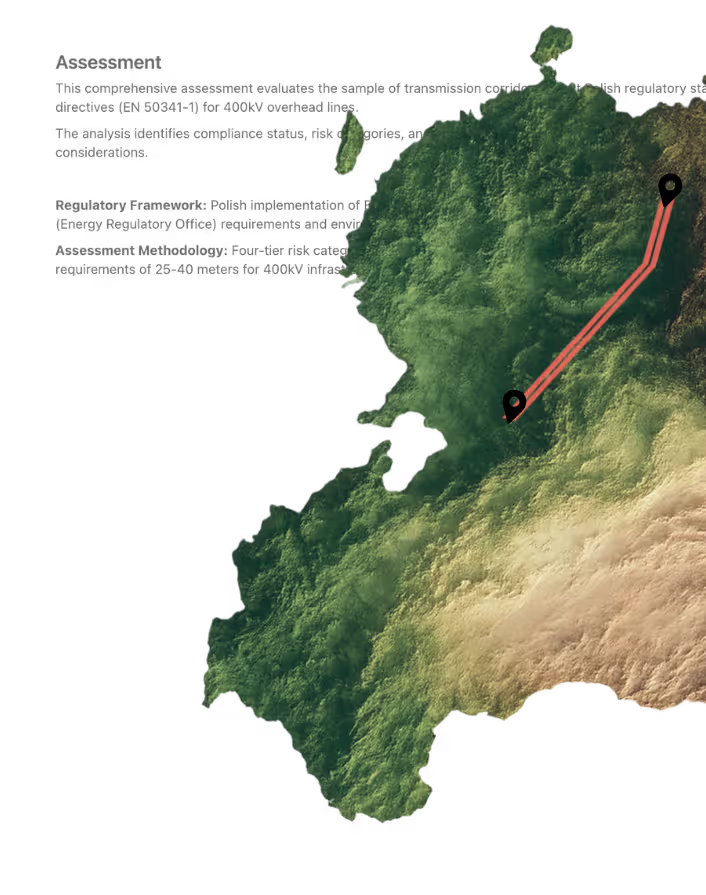
Automated monitoring logs and visual evidence make compliance reporting straightforward.
Demonstrate clearance verification, inspection frequency, and response times with audit-ready documentation.
We don't hide how risk scores are calculated. Every assessment shows the underlying data — satellite imagery, vegetation indices, proximity measurements, climate inputs. You understand why a tree scores high-risk, not just that it does.
Most platforms require 6-month implementations and enterprise minimums. We run 4-week pilots on your priority corridors. You see results before committing to network-wide coverage.
Our team has analyzed 600M+ hectares for carbon projects and deforestation monitoring. We understand tree species behavior, growth patterns, and ecosystem dynamics — not just computer vision outputs.
You work directly with vegetation scientists and geospatial analysts, not account managers reading scripts. When you have questions about methodology or edge cases, you talk to people who built the models.

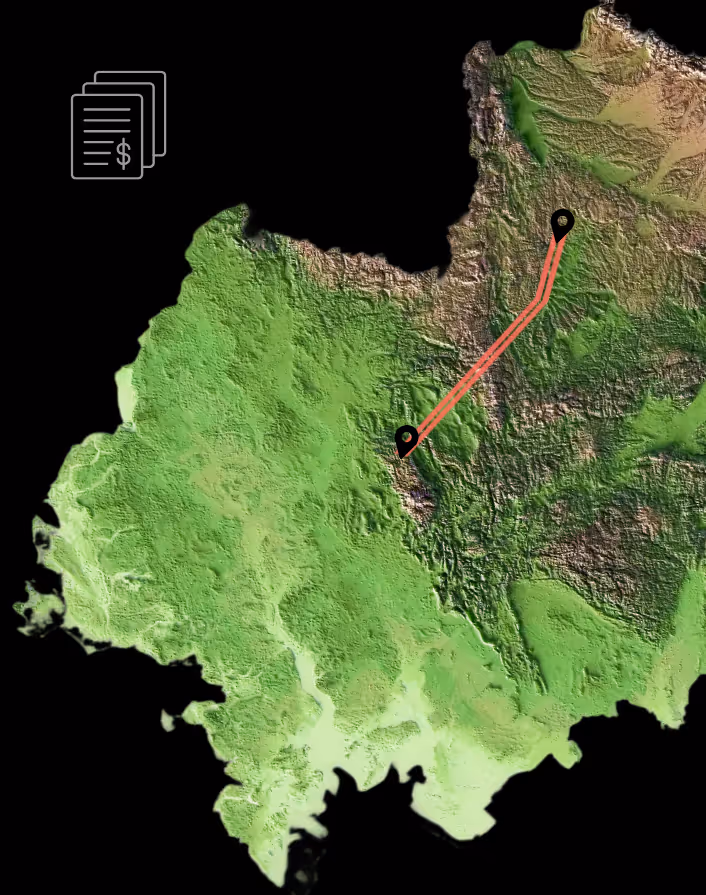
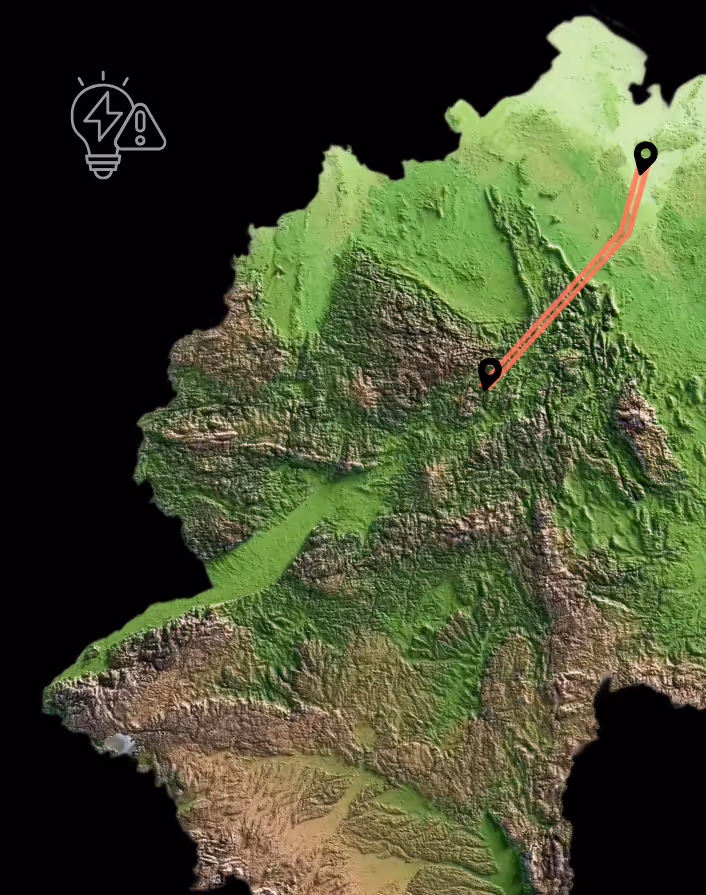
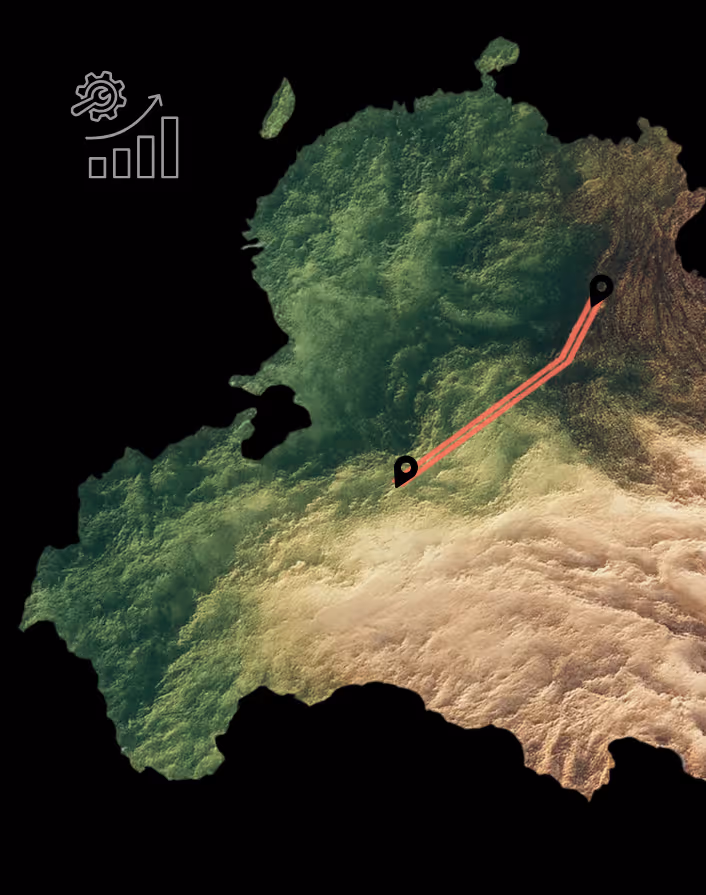
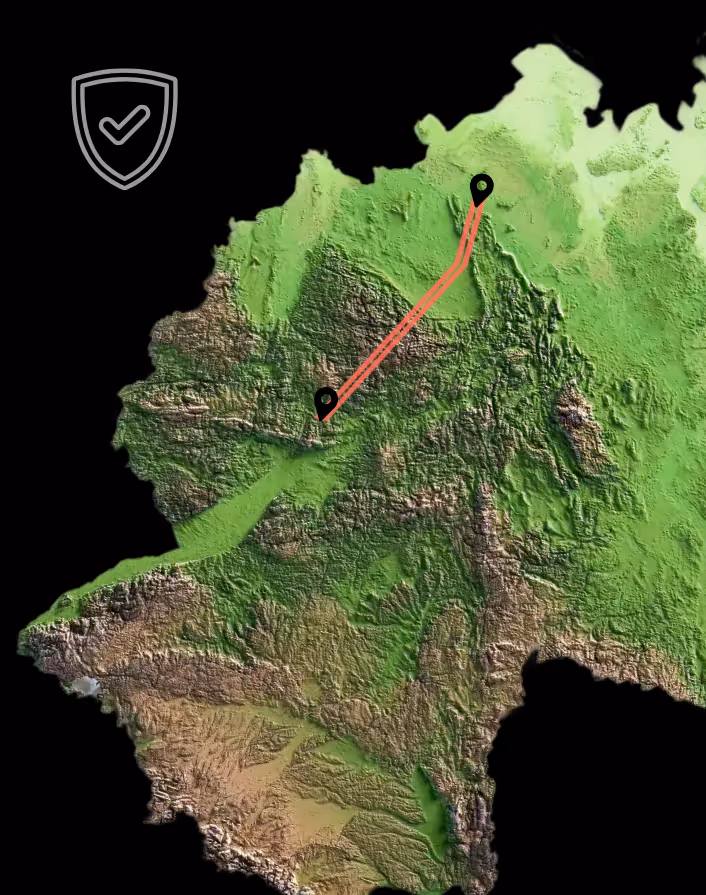
A South American Distribution Network operator needed to monitor vegetation and infrastructure risk along 87 pole-to-pole segments of a 10 km transmission corridor. Over a 4-week pilot, they required vegetation proximity monitoring and risk classification, individual tree counting, infrastructure detection and assessment of climate hazards and risks.
Using high-resolution satellite imagery, Orbify analyzed the transmission corridor, identifying 6,834 individual trees, 12 structures that posed a threat to transmission line integrity, and categorized vegetation and tree fall risk for each segment. Our analysis allowed targeted remediation work to be undertaken, preventing the need for costly ground inspections. Our vegetation analytics - refined across 600M+ hectares for carbon and deforestation monitoring- now enable predictive grid maintenance at scale.


Orbify monitors vegetation threats, climate risks, and infrastructure changes across your entire network — so you can prevent outages, optimize maintenance, and stay compliant.
Start with a 4-week pilot on your priority corridors. No enterprise contracts. No multi-month implementations. Just results you can verify against field data.